
This post is a part of our Survey Data Season series where we examine data from various surveys that are released annually from the summer through early fall. Find all of the Survey Data Season series posts on our Survey Data Season 2025 page here.
On September 9, 2025, the U.S. Census Bureau released an initial report containing data on health insurance coverage across the United States in 2024. The estimates presented in the report are drawn from the Current Population Survey Annual Social and Economic Supplement (CPS ASEC), representing a measure of coverage that looks at the full calendar year. Meaning that people are considered insured if they had coverage for part or all of the year, and are considered uninsured if they did not have coverage for all of the year.
As had been the case for the past few years, the latest report release does not include state-level data; the Census Bureau plans to publish those state-level estimates via the American Community Survey (ACS) data release on Thursday, September 11, 2025. Learn more about the differences between the ACS and CPS here.
The following blog post explores this newly released 2024 CPS data, including changes in national-level coverage rates by demographic characteristics such as age, employment, race and ethnicity, immigration status, poverty status, and Medicaid expansion status.
Uninsured Rates Across the Nation in 2024
Overall, data from the “Health Insurance Coverage in the United States: 2024” report showed that 8.0% of the United States population was uninsured during the previous year. This was not a statistically significant change from the uninsured rate in 2023 (7.9%).
Uninsured rates were also largely unchanged across demographic categories, with almost no overall significant changes in rate occurring for the total population by age; race and ethnicity; immigration, marital, or employment status; or by geographic region (Northeast, Midwest, South, and West).
The sole exception was a slight, but significant, decrease in uninsurance for adults age 35–44, falling from 11.7% in 2023 to 10.8% in 2024.
Uninsured Rates by Age and Demographic Category in 2024
As with the total population, rates of uninsurance were largely unchanged by age from 2023 to 2024.
Children (age 0–18) had an uninsured rate of 6.1% in 2024, which was not significantly different from a rate of 5.8% in 2023. No significant changes in uninsured rates were seen across most available demographic categories either (race and ethnicity, immigration status, or geographic region).
The sole exception was a significant increase in uninsured rates for children who lived in states that did not expand Medicaid (nonexpansion states) and whose income was at or above 400% of the poverty level. The rate of uninsurance for this group of children rose from 3.5% in 2023 to 5.1% in 2024.
The overall rate of nonelderly adults (age 19–64) without health insurance coverage in 2024 was 11.0%, statistically unchanged from a rate of 10.9% in 2023. However, some changes were noted for this age group across several demographic categories. Nonelderly Black adults, for instance, saw a significant increase in their uninsured rates, rising from 11.1% in 2023 to 12.3% in 2024.
The rate of uninsured nonelderly adults also rose in the Midwest region, increasing from 8.1% in 2023 to 9.0% in 2024. However, married nonelderly adults reported a decrease in uninsured rates from 7.9% in 2023 to 7.4% in 2024.
Private and Public Coverage Rates Across the Nation in 2024
Both private and public health insurance coverage experienced nearly offsetting levels of change between 2023 and 2024.
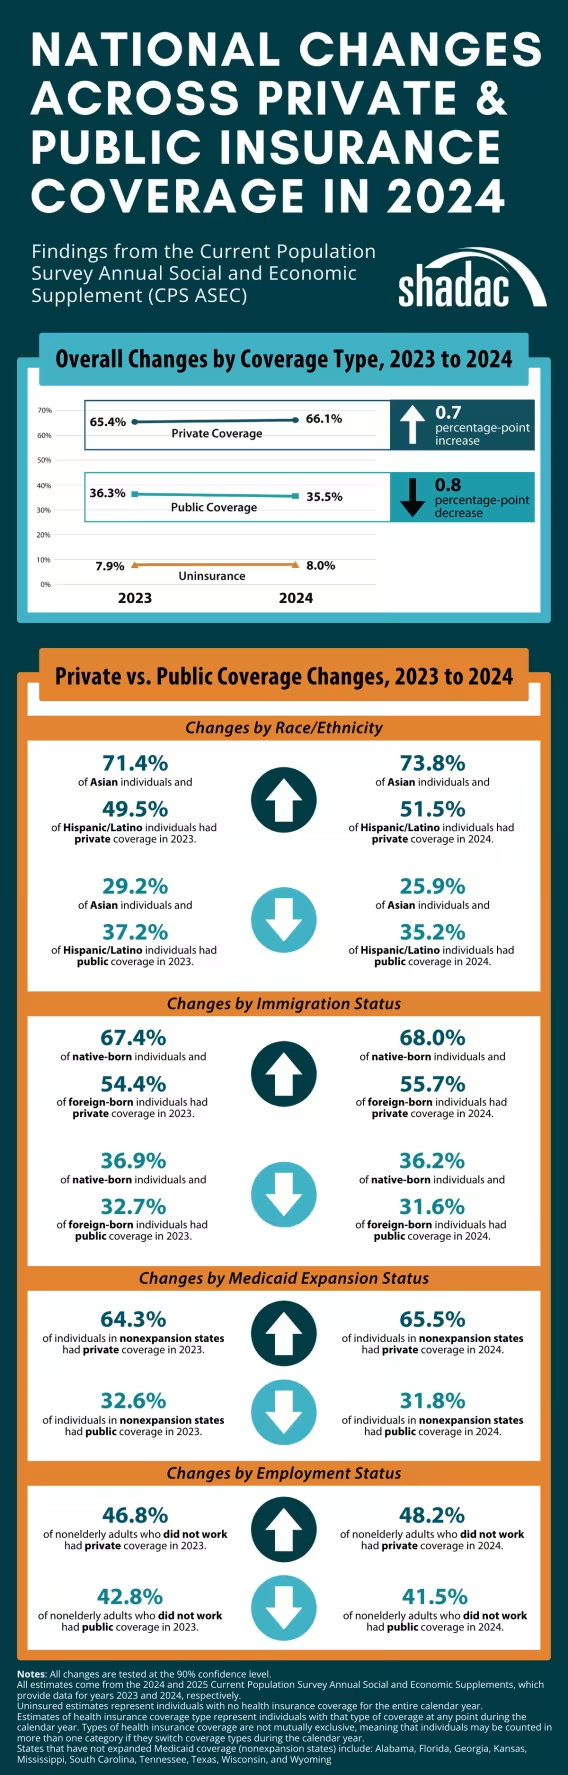
Among all persons, the percentage of the population with private insurance coverage in 2024 was 66.1%, a significant increase of 0.7 percentage points from 65.4% in 2023. While employer-sponsored insurance (ESI) coverage remained the most prevalent form of private coverage at a rate of 53.8% in 2024, the rate of the total population who had ESI coverage remained statistically unchanged from 2023 (53.8%).
All other forms of private coverage experienced incremental increases between the two years:
- Direct-purchase coverage saw the largest increase of 0.5 percentage points, rising from 10.2% in 2023 to 10.7% in 2024.
- Marketplace coverage also saw an increase, climbing from 4.0% in 2023 to 4.3% in 2024.
- TRICARE coverage increased by 0.2 percentage points from 2.6% in 2023 to 2.8% in 2024.
Just 35.5% of the U.S. population had any form of public health insurance coverage in 2024, a decrease of 0.8 percentage points from 2023. This decrease was driven in large part by a 1.3 percentage point decline in Medicaid coverage, which dropped to 17.6% in 2024 from 18.9% in 2023. Other notable changes in public health insurance coverage between 2023 and 2024 included a slight increase of 0.2 percentage points for Medicare (18.9% to 19.1%) and VA and CHAMPVA (1.0% to 1.2%).
Private and Public Coverage Rate Changes by Demographic Characteristics in 2024
Race and Ethnicity
Across measured racial and ethnic categories, Asian individuals and Hispanic/Latino individuals both experienced significant changes in private and public insurance coverage between 2023 and 2024.
Private coverage rose by 2.4 percentage points among Asian individuals, increasing from 71.4% in 2023 to 73.8% in 2024. Conversely, public coverage among Asian individuals fell significantly by 3.3 percentage points, decreasing from 29.2% in 2023 to 25.9% in 2024.
Private coverage also increased among Hispanic/Latino individuals, climbing by 2.0 percentage points from 49.5% in 2023 to 51.5% in 2024. Public coverage decreased among Hispanic/Latino individuals, falling from 37.2% in 2023 to 35.2% in 2024.
Immigration Status
Overall trends among private and public coverage rates between 2023 and 2024 also held true when looking at the population by immigration status. Native-born individuals saw their rates of private coverage increase by 0.6 percentage points from 67.4% in 2023 to 68.0% in 2024, and rates of public coverage decrease by 0.7 percentage points from 36.9% in 2023 to 36.2% in 2024.
Foreign-born individuals saw their rates of private coverage increase by 1.3 percentage points from 54.4% in 2023 to 55.7% in 2024, and rates of public coverage decrease by 1.1 percentage points from 32.7% in 2023 to 31.6% in 2024.
Medicaid Expansion Status
Across the 40 states and District of Columbia which have expanded Medicaid coverage under the provisions of the Affordable Care Act (ACA), rates of private coverage remained statistically unchanged from 2023 (65.8%) to 2024 (66.3%). Rates of public coverage, however, decreased by 0.8 percentage points from 2023 (37.8%) to 2024 (37.0%).
In the 10 states that have not yet expanded Medicaid coverage as of January 2024, rates of private coverage increased significantly by 1.2 percentage points from 2023 (64.3%) to 2024 (65.5%). Rates of public coverage decreased by 0.8 percentage points from 2023 (32.6%) to 2024 (31.8%).
Age and Poverty Level
Children (age 0–18) and nonelderly adults (age 19–64) whose incomes were between 100% and 399% of the poverty level both saw significant decreases in public coverage rates between 2023 and 2024. Children’s public coverage rates decreased by 1.9 percentage points from 45.0% to 43.1% in 2024. Nonelderly adults’ public coverage rates decreased by 1.2 percentage points from 26.3% to 25.1% in 2024.
Private and Public Coverage Rate Changes for Nonelderly Adults (Age 19–64) in 2024
Overall, trends in private and public insurance coverage for nonelderly adults mirrored those for the overall population, with private coverage increasing from 73.1% in 2023 to 74.0% in 2024 (0.9 percentage points) and public coverage rates decreasing from 19.0% in 2023 to 17.9% in 2024 (1.1 percentage points).
Marital Status
Married nonelderly adults saw their rates of private coverage increase significantly by 1.5 percentage points from 2023 (81.8%) to 2024 (83.3%). Public coverage rates among married nonelderly adults fell significantly by 1.0 percentage points from 2023 (13.6%) to 2024 (12.6%).
Among unmarried nonelderly adults, rates of private coverage were statistically unchanged from 2023 (64.0%) to 2024 (64.7%). Rates of public coverage, however, decreased significantly among unmarried adults, falling by 1.3 percentage points from 2023 (24.5%) to 2024 (23.2%).
Disability Status
Nonelderly adults who reported living with a disability did not see any significant changes in either private or public coverage between 2023 and 2024. Nonelderly adults who did not report living with a disability experienced both a significant increase in private coverage from 2023 (75.2%) to 2024 (76.1%) and a corresponding significant decrease in public coverage from 2023 (16.1%) to 2024 (15.1%).
Employment Status
Among nonelderly adults who had both full-time and part-time work in 2024, private insurance coverage rose significantly by 0.7 percentage points between 2023 and 2024, increasing from 80.1% to 80.8%. Public coverage decreased for this group, falling by 0.9 percentage points from 12.6% in 2023 to 11.7% in 2024.
Trends in private and public coverage were similar among nonelderly adults who did not work in 2024. Private coverage rose significantly by 1.4 percentage points from 2023 to 2024, climbing from 46.8% in 2023 to 48.2% in 2024. Public coverage fell significantly by 1.3 percentage points from 42.8% in 2023 to 41.5% in 2024.
Along with these high-level estimates of health insurance coverage by employment status in the main report, Census Bureau researchers have released a special companion blog on health insurance coverage trends by specific occupation via their “America Counts” series of publications. The blog examines uninsured rates by a number of different employment sectors, finding that workers in the architectural field had an uninsured rate of just 2.5% in 2024, while those in farming, fishing, and forestry industries had an uninsured rate of 29.4% in 2024.
Read the full blog for more details and information.
External Impacts on Data Collection and Publication
Concluding the Continuous Coverage Requirement and the Medicaid Unwinding
The continuous coverage requirement that prevented states from terminating individuals’ Medicaid coverage during the COVID-19 pandemic ended on March 31, 2023. Each state was given a 14-month period—beginning on April 1, 2023 and ending on June 30, 2024—to resume normal Medicaid eligibility redeterminations and renewals (and potential disenrollments). This process has been commonly referred to as “the Medicaid unwinding” or even more simply as “the unwinding.”
Due to this mid-year shift in Medicaid processes and the fact that different states implemented redeterminations, renewals, and disenrollments at different speeds, it is important to note that full-year 2024 estimates from all surveys, including the CPS and ACS, will not be fully reflective of the coverage shifts and changes that researchers have documented during the unwinding process.
However, provisional data from sources like the Census Bureau’s Household Pulse Survey (HPS)—now rebranded to the Household Trends and Outlook Survey, (HTOPS)—can give a more responsive indicator of coverage trends during the unwinding. If you are interested in learning more about the nuances of change that occurred during the unwinding period, SHADAC researchers compiled a concise and informative historical data resource that can be found here: Tracking Health Insurance Coverage During the Unwinding: Monthly Data from the Household Pulse Survey
CPS ASEC Data Collection: Response Rates and Nonresponse Bias
In a companion blog to the recently released Current Population Survey reports on health insurance coverage, poverty levels, and income statistics, Census Bureau researchers noted that the issues of lower response rates and nonresponse bias in the CPS ASEC, which began during the COVID-19 pandemic, have continued into this year. The CPS ASEC recorded a 62.0% response rate in 2025 compared to 69.0% in the pre-pandemic year of 2019.
While the blog notes that low response rates in and of themselves are not inherently problematic, issues can arise when certain types of respondents are overrepresented in the data as compared to nonrespondents. For example, starting in 2020, the CPS ASEC began to see more respondents with reported higher earnings than in years prior. Additionally, Census researchers have found that differences in median earnings between respondents and nonrespondents were statistically significant in each year since 2019 (2020–2025). This difference has the potential to, in turn, affect overall income and poverty estimates.
The Census Bureau has continued to monitor these issues since they first arose during the COVID-19 pandemic, and has begun to develop a number of methods to address them, including combining data from different sources to produce improved estimates of the income distribution as well as creating and employing an alternative weighting scheme.
Related Releases and Materials
Upcoming Data Release: ACS
As previously mentioned, the Census Bureau will be releasing 2024 estimates from the American Community Survey (ACS)—including coverage rates at the state level—on Thursday, September 11, 2025. SHADAC will be monitoring this release and providing updates, along with a blog post analyzing the data, as soon as they are available.
Upcoming Webinar: 2024 Health Insurance Coverage: Exploring the Latest Data from the ACS and CPS
On Thursday, September 25th at 1:00 PM CST, SHADAC will host a webinar covering the release of new Census data on health insurance coverage estimates for 2024. The estimates come from two key federal surveys conducted by the U.S. Census Bureau: The American Community Survey (ACS) and the Current Population Survey (CPS).
SHADAC researchers and presenters will discuss larger health insurance data trends for 2024 at national and state levels, and will also cover more granular data by different insurance coverage types and demographic categories, such as age, geography, poverty level, and more.
In addition, SHADAC will walk through how to access the data and examples of how to use it to answer research questions. We are also pleased to once again welcome a special guest—U.S. Census Bureau Assistant Division Chief Sharon Stern—who will join us to answer questions from attendees after the main discussion.
Register for the webinar here!
Notes
- All changes are tested at the 90% confidence level.
- All estimates come from the 2024 and 2025 Current Population Survey Annual Social and Economic Supplements, which provide data for years 2023 and 2024, respectively.
- Uninsured estimates represent individuals with no health insurance coverage for the entire calendar year.
- Estimates of health insurance coverage type represent individuals with that type of coverage at any point during the calendar year. Types of health insurance coverage are not mutually exclusive, meaning that individuals may be counted in more than one category if they switch coverage types during the calendar year.
- States that have not expanded Medicaid coverage (nonexpansion states) include: Alabama, Florida, Georgia, Kansas, Mississippi, South Carolina, Tennessee, Texas, Wisconsin, and Wyoming.