
This post is a part of our Survey Data Season series where we examine data from various surveys that are released annually from the summer through early fall. Find all of the Survey Data Season series posts on our Survey Data Season 2026 page here.
On Sept. 15, the U.S. Census Bureau released a report with national-level data on health insurance coverage across the United States in 2025, drawing from the Current Population Survey’s Annual Social and Economic Supplement (CPS ASEC).
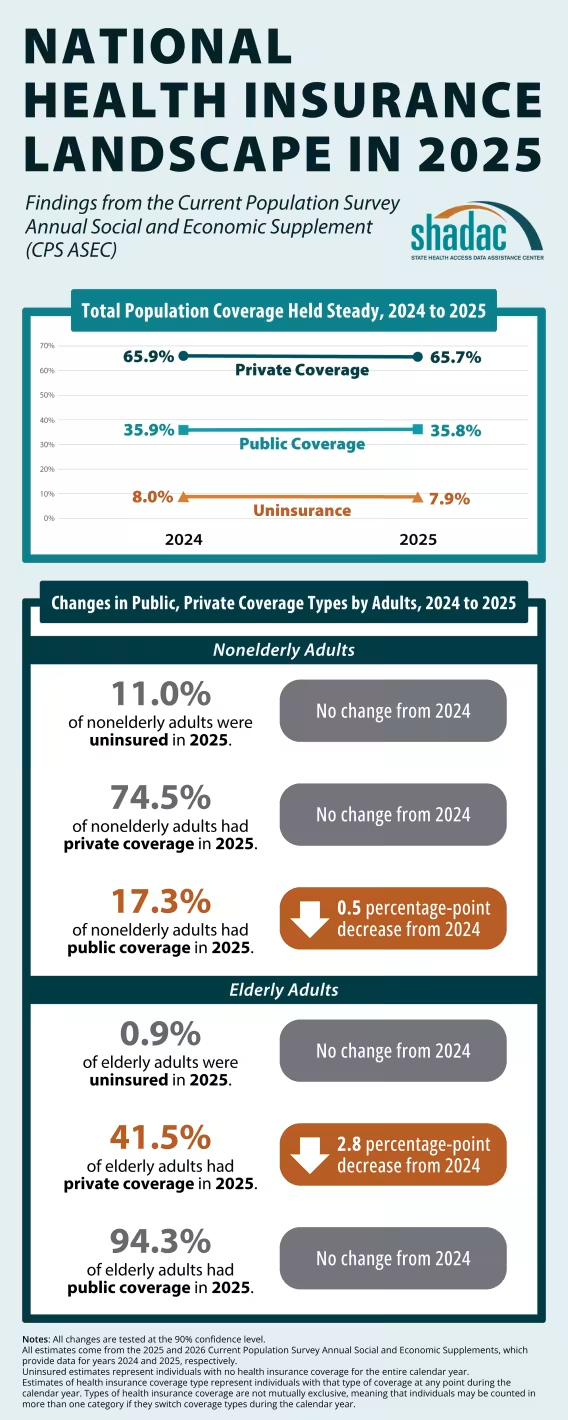
At the U.S. level, the total rate of people without health insurance was 7.9% in 2025, which was not significantly different from 2024. At 65.7%, the total population rate of people with any private coverage in 2025 was not significantly different from 2024; and at 35.8%, the total population rate of people with any public coverage in 2025 was not significantly different from 2024.
The report’s CPS ASEC estimates represent a measure of coverage based on the full calendar year. For these estimates, people are considered insured if they had coverage all or part of the year, and they are only considered uninsured if they lacked coverage for the entire year.
As in recent years, the latest report release does not include state-level data; the Census Bureau plans to publish state-level estimates via the American Community Survey (ACS). While the Census Bureau typically releases health insurance coverage data from ACS alongside the CPS ASEC data, this year’s ACS data release has been delayed in response to the U.S. Commerce Department’s new policy on disclosure avoidance for statistical products.
SHADAC plans to publish another blog about state-level health insurance estimates based on ACS data once those become available. Learn more about the differences between the ACS and CPS here.
This blog post explores the newly released 2025 CPS data, including changes in national-level insurance rates by coverage type and age categories.
U.S. Coverage Rates Held Largely Steady in 2025
As mentioned above, the total population rate of uninsurance in 2025 was not statistically different from 2024, based on CPS ASEC data from the “Health Insurance Coverage in the United States: 2025” report.
Uninsurance
The uninsurance rate of 5.8% for people under age 19 (i.e., children) was not significantly different from 2024; the uninsurance rate of 11.0% for people age 19-64 (i.e., working-age adults) was not significantly different from 2024; and the uninsurance rate of 0.9% for people age 65 and older was not significantly different from 2024.
Private Coverage
Rates of private coverage did not change significantly for children or working-age adults between 2024 and 2025. The overall rate of private coverage for elderly adults declined 2.8 percentage points to 41.5% in 2025, with a decline of 1.5 percentage points to 20.5% in 2025 for employer-sponsored coverage and a decline of 1.4 percentage points to 18.4% in 2025 for direct-purchase coverage.
Public Coverage
The rate of public coverage did not change significantly for children between 2024 and 2025. The rate of public coverage for working-age adults declined 0.5 percentage points to 17.3% in 2025, with a decline of 0.6 percentage points to 14.2% for Medicaid coverage in 2025. The rate of public coverage for elderly adults did not change significantly from 2024 to 2025, though the rate of Medicaid coverage increased 0.7 percentage points to 7.4% in 2025.
External Impacts on Data Collection and Publication
CPS ASEC Data Collection - Response Rates and Nonresponse Bias
In a companion blog to the recently released Current Population Survey reports on health insurance coverage, poverty levels, and income statistics, Census Bureau researchers noted that the issues of lower response rates and nonresponse bias in the CPS ASEC, which began during the COVID-19 pandemic, have continued into the 2026 survey (i.e., estimates for 2025 year). The 2026 CPS ASEC (i.e., 2025 estimates) recorded a 61.3% response rate compared to 69.0% in the 2019 CPS ASEC (i.e., 2018 estimates), before the pandemic affected data collection in 2020.
While the blog notes that low response rates in and of themselves are not inherently problematic, issues can arise when certain types of respondents are over- or under-represented in the data as compared to nonrespondents. For example, starting with 2020 data collection, the CPS ASEC began to see more respondents with reported higher earnings than in years prior. Additionally, Census researchers have found evidence of differences in median earnings between respondents and nonrespondents.
This difference has the potential to affect overall income and poverty estimates. However, Census states that because bias stemming from survey nonresponse has been relatively steady since the pandemic, comparisons of estimates during post-pandemic years (i.e., 2020 data and later) “have not been significantly biased,” and only comparisons between pre- and post-pandemic data would be significantly biased.
The Census Bureau has continued to monitor these issues since they first arose during the COVID-19 pandemic, and has been working to develop methods to mitigate them, including employing data from different sources to improve estimates of income distribution, as well as creating and employing an alternative weighting scheme.
Notes
- All changes are tested at the 90% confidence level.
- All estimates come from the 2025 and 2026 Current Population Survey Annual Social and Economic Supplements, which provide data for years 2024 and 2025, respectively.
- Uninsured estimates represent individuals with no health insurance coverage for the entire calendar year.
- Estimates of health insurance coverage type represent individuals with that type of coverage at any point during the calendar year. Types of health insurance coverage are not mutually exclusive, meaning that individuals may be counted in more than one category, for instance, if they switch coverage types during the calendar year.
- States that have not expanded Medicaid coverage (nonexpansion states) as allowed by the Affordable Care Act include: Alabama, Florida, Georgia, Kansas, Mississippi, South Carolina, Tennessee, Texas, Wisconsin, and Wyoming.
Related Releases and Materials
Upcoming Data Release: As previously mentioned, the Census Bureau plans to release 2025 estimates from the American Community Survey (ACS)—including coverage rates at the state level—on an upcoming date, to be announced. SHADAC will monitor this release and provide updates, along with a blog post analyzing the data, once they are available.