
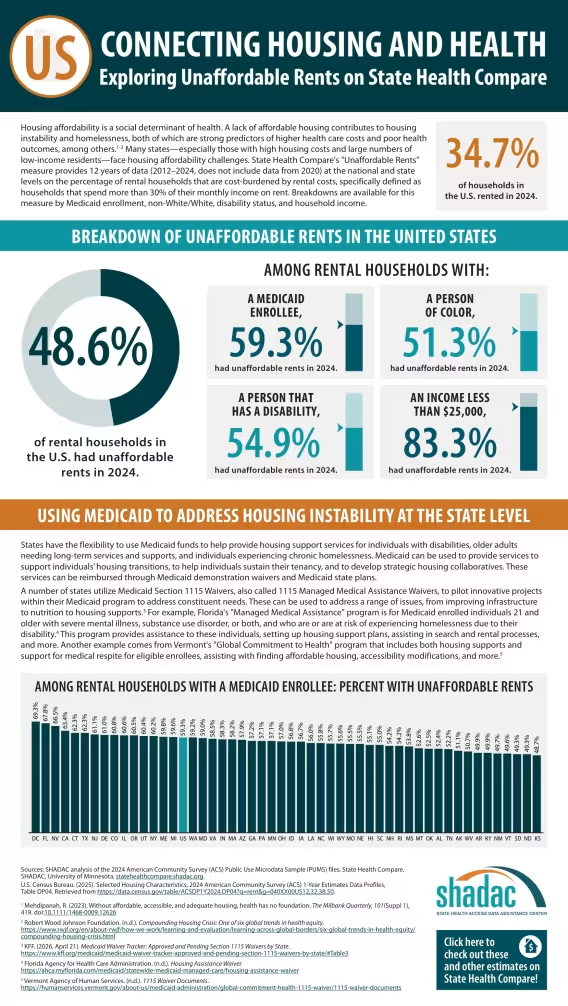
On SHADAC’s data tool State Health Compare, our researchers and experts perform analysis on data from over 15 sources to populate 40+ measures of health care coverage, access, and utilization, and social and economic factors that can influence health, such as food security, adverse childhood experiences (ACEs), and, the focus of this post, unaffordable rents.
‘Unaffordable rents’ are defined as rental costs that require a household spend more than 30% of their income on rent. As of 2024, almost half (48.6%) of households in the U.S. reported unaffordable rental cost burden—marking an almost 3 percentage point (PP) increase from just five years prior in 2019 (45.9%).*
Acting as an accompaniment to the blog reviewing national rates of unaffordable rents from 2019 to 2024, this post provides infographics that describe unaffordable rents data for the U.S. overall and for four geographically diverse states (Florida, Nevada, North Dakota, and Vermont) with varying levels of unaffordable rents.
These infographics aim to highlight the range of experiences in unaffordable rents across the country, including each state’s overall rate of unaffordable rents as well as disaggregated data broken down by household income, Medicaid enrollment, race/ethnicity (White vs. Non-White), and disability status.
How Are Housing and Health Connected?
Housing is a key driver of health; housing cost burdens can contribute to housing instability, homelessness, and reduced income available for necessities, all of which are predictors of poor health outcomes and higher overall health care costs. Additionally, housing costs can affect where people live, which can influence housing type (i.e., apartment, multi-family home, unhoused), location (i.e., rural, urban, close or far from workplace), and access to services and supports (i.e., schools, clinics/hospitals, childcare, transportation).
Additionally, and as we review in this accompanying blog exploring national rates and breakdowns of unaffordable rents data, “when people are burdened by rent that is unaffordable—combined with the also rising cost of living and increased spending on health care—they may look to cut costs in other areas. Some individuals may choose to forgo medical care or make changes to medical drugs due to cost to save money, while others might forgo other necessities” such as the 20% of Americans who reported skipping meals to make housing payments or the 11% who drove less to afford health care expenses.
It’s important to continue to track and monitor trends in housing cost burdens over time to understand trends, changes, and impacts of current events, policies, and programs. Understanding how housing costs impact different households and communities is essential for planning, implementing, and monitoring programs and initiatives that work to provide people with affordable and stable housing.
Housing Affordability Infographics
To represent the diversity of the experience of unaffordable rent across states, SHADAC has chosen to highlight the 2024 unaffordable rents data as infographics for four different states: Florida, Nevada, North Dakota, and Vermont. These four states represent a mix of geographic diversity and levels of unaffordable rent.
Along with the national infographic above, you’ll find SHADAC’s Unaffordable Rents Infographics for four states below. Click on the image of each one to enlarge.
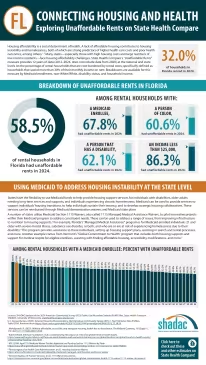
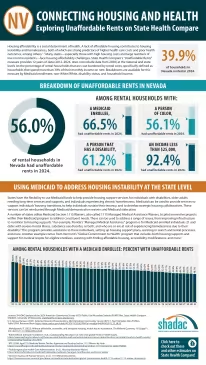
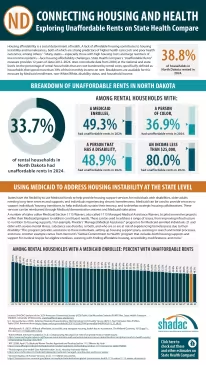
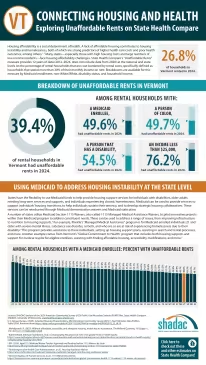
Breaking down these data shows just how much unaffordable rent differs across states and by population within each state.
For example, Vermont has one of the lowest rates of cost-burdened rental households in the U.S. at 39.4%. But when you look at rental households in Vermont with incomes less than $25,000, over 76% have unaffordable rent—almost double the state’s overall rate.
Nevada, on the other hand, has one of the highest overall rates of unaffordable rent in the U.S. at 56.0%. When looking at rental households in Nevada with a person of color, 56.1% had unaffordable rent—almost equal to the overall rate of unaffordable rent. However, when looking at these data by those with an income of less than $25,000 in Nevada, it’s a staggering 92.4%.
Understanding housing affordability by state and between different communities within each state is crucial for targeting programs and interventions toward the groups that need the most assistance or support.
Explore More Health Data on State Health Compare
While these infographics highlight housing affordability data from four diverse states, you can find housing affordability data for all 50 states by each breakdown on State Health Compare.
On State Health Compare, you can easily explore data on unaffordable rents going back to 2012, comparing trends and information over time. You can also easily generate data visualizations, maps, customized data sets, and more to start your own analysis of unaffordable rents in the United States.
Along with data on housing affordability, State Health Compare also allows you to explore other measures that can influence health, health care costs and access, and health outcomes with a variety of breakdowns, such as:
- Median Medical Out-of-Pocket Spending
- Adults with Fair or Poor Health Status
- Health Insurance Coverage Type
We would love to hear how you use State Health Compare; let us know on LinkedIn or by contacting us here.
*Note: Data for 2020 were not officially released by the U.S. Census Bureau due to pandemic-related disruptions to data collection and resulting issues with data quality. Therefore, data references for “the last five years” goes back to 2019.