
Blog & News


2018 County Health Insurance Estimates Now Available
April 17, 2020:The U.S. Census Bureau has released the Small Area Health Insurance Estimates (SAHIE) for 2018, providing estimates of health insurance coverage for all counties and states. This year, the Census Bureau has also added an animated map tool, so that users can view county coverage trends over time for the past decade (2008-2018).
The SAHIE program is the only source of single-year health insurance estimates for every county in the US. Estimates are available for each county by sex, age, and Federal Poverty Level (FPL). Race/ethnicity information is available at the state level.
The following are highlights from the 2018 SAHIE release.
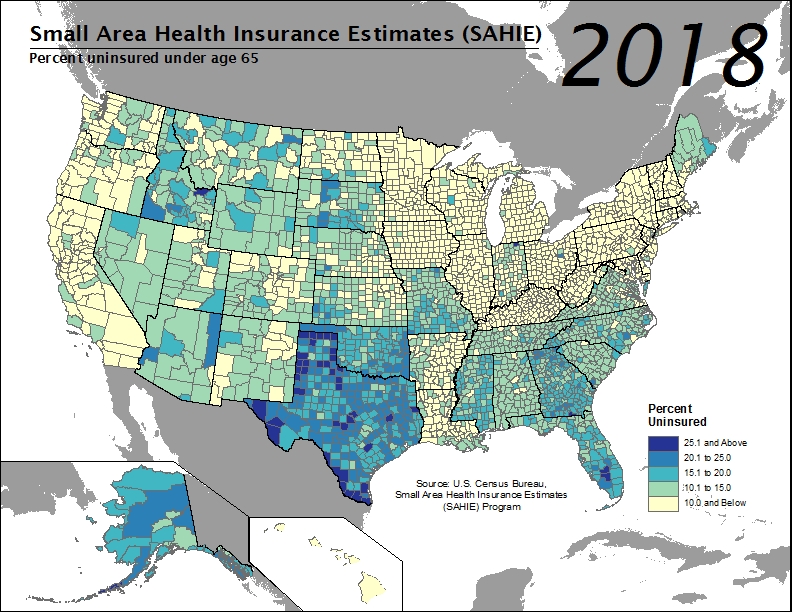 Across the nation in 2018, county uninsured rates for the nonelderly population (i.e., under age 65) ranged from 2.4% to 32.2%, with a median county uninsured rate that held steady from the previous year at 10.6%.
- In 1,184 counties, or approximately 37.7% of all counties, the 2018 nonelderly uninsured rate was at or below 10%. An estimated 493 counties (15.7%) had uninsured rates greater than or equal to 15.0%, a figure which was unchanged from 2017.
- Among the 493 counties with uninsured rates at or above 15.0%, the majority (85.0%, or 419 counties) were located in the South. The remaining were located in the Midwest (36 counties) and West (38 counties). No counties in the Northeast fell into this category.
- Alaska, Florida, Georgia, Idaho, Indiana, and Texas all had counties with 2018 nonelderly uninsurance rates that exceeded 25.0%.
- In states that expanded Medicaid eligibility, 7.9% of counties (119 out of 1,498 counties) had an estimated uninsured rate above 20.0%, compared to 80.8% of counties (1,327 out of 1,643 counties) in states that did not expand it.
- From 2017 to 2018, the nonelderly population (i.e., under age 65) in over 95% of counties (2,990) did not have a statistically significant change in their uninsured rate. Among counties that did experience changes in their uninsured rates, more saw an increase (81 counties) than a decrease (70 counties).
Access the full 2018 SAHIE report and visualizations.
Access the 2018 SAHIE estimates.
Find your county’s 2018 uninsured rate using SAHIE’s interactive data tool.
About SAHIE
SAHIE are created using statistical models that combine American Community Survey (ACS) data with population estimates and administrative records.
SAHIE are consistent with the direct ACS survey estimates, but SAHIE are more precise than the ACS 1-year and 5-year survey estimates alone for most counties because SAHIE are supplemented with other data sources.
The SHADAC brief entitled Small Area Health Insurance Estimates from the Census Bureau provides an overview of how the SAHIE are developed as well as a comparison of the SAHIE model-based methodology to that used by ACS (see Table 2 in the brief).
Blog & News
Now Available on State Health Compare: Eleven Updated Measures and One Brand New Measure
December 3, 2019:Estimates for measures from a variety of categories (Health Outcomes, Health Behaviors, Access to Care, Cost of Care, and Social and Economic Factors, etc.) have now been updated on SHADAC’s State Health Compare web tool. All measures now contain data for 2018, the most recent year available. State Health Compare has also added a brand new measure, Adult E-Cigarette Use.
Updated Measures Include:
Income Inequality
Using the Gini coefficient (a summary of the dispersion of income across the entire income distribution), this measure gauges disparities in income in each state on a scale from 0 to 1, with higher values indicating greater inequality and lower values indicating the opposite. Estimates for all states are now available from 2006 through 2018.
Sales of Opioid Painkillers
This measure captures the rate of legal prescription opioid painkiller sales in kilograms per 100,000 people per year for both hydrocodone and oxycodone—the most common types of prescription opioids. Data is now available for all states from 2000 through 2018.
Adults Who Forgo Needed Medical Care*
The measure indicates the percent of adults (18+) in each state who could not get needed medical care due to cost. Breakdowns by education level and race/ethnicity are available for all states from 2005 through 2010 and 2011 through 2018.
Adults With No Personal Doctor*
This measure denotes the percent of adults without a personal doctor and is now available for all states from 2005 through 2010 and 2011 through 2018. Breakdowns by education level and race/ethnicity are also available.
Adult Cancer Screenings*
The measure is an indication of the percent of adults who have received recommended cancer screenings (e.g., colorectal screenings, mammograms, pap smears, etc.) in the past year, and is now available for all states from 2005 through 2010 and 2011 through 2018.
Chronic Disease Prevalence*
This measure captures the percent of adults who reported having one or more common chronic conditions such as diabetes, cardiovascular disease, heart attack, stroke, and asthma, in each state. Estimates are now available for all states from 2005 through 2010 and 2011 through 2018.
Activities Limited due to Health Difficulty*
This measure reports the average number of days (in the last 30 days) for which an adult indicates limited activity due to mental or physical health difficulties. It is now available for all states from 2005 through 2010 and 2011 through 2018.
Adult Obesity*
The measure is an indication of the prevalence of obesity, defined as a Body Mass Index (BMI) > 30, among the adult population 18 years of age and over. It is now available for all states from 2005 through 2010 and 2011 through 2018.
Adult Binge Drinking*
This measure indicates the percent of adults who, on one occasion, have consumed at least four drinks (women) or five (men) or more in the past 30 days. Now available for all states from 2005 through 2010 and 2011 through 2018, the measure includes breakdowns by education level and race/ethnicity.
Adult Smoking*
This measure indicates the percent of adults over 18 years of age who have smoked 100 or more cigarettes in their lifetime, and who currently smoke some days or every day. It is now available for all states from 2005 through 2010, and 2011 through 2018.
Adult E-Cigarette Use (Newly available measure on State Health Compare)
This measure indicates the percent of the adult population (18 years of age and over) who currently use e-cigarette some days or every day. It is now available for all states from 2016 through 2017 and for most states for 2018. Breakdowns are available by education level and race/ethnicity.
Data Sources
The State Health Compare estimates for income inequality come from the American Community Survey (ACS); the sales of opioid painkillers comes from the U.S. DEA’s Automated Reports Consolidated Ordering System Retail Drug Summary Reports; and the measures of chronic disease prevalence, activities limited due to health difficulty, and the adults who forgo needed medical care, adults with no personal doctor, and adult cancer screenings, obesity, binge drinking, smoking, and e-cigarette use measures all come from the Behavior Risk Factor Surveillance System (BRFSS).
Notes
All measures marked with an “*”: This indicates a break in series due to the BRFSS implementing cell phone sampling and an advanced weighting method in 2011.
Blog & News

Alternatives to ACA Compliant Plans in the Individual Market
November 15, 2019: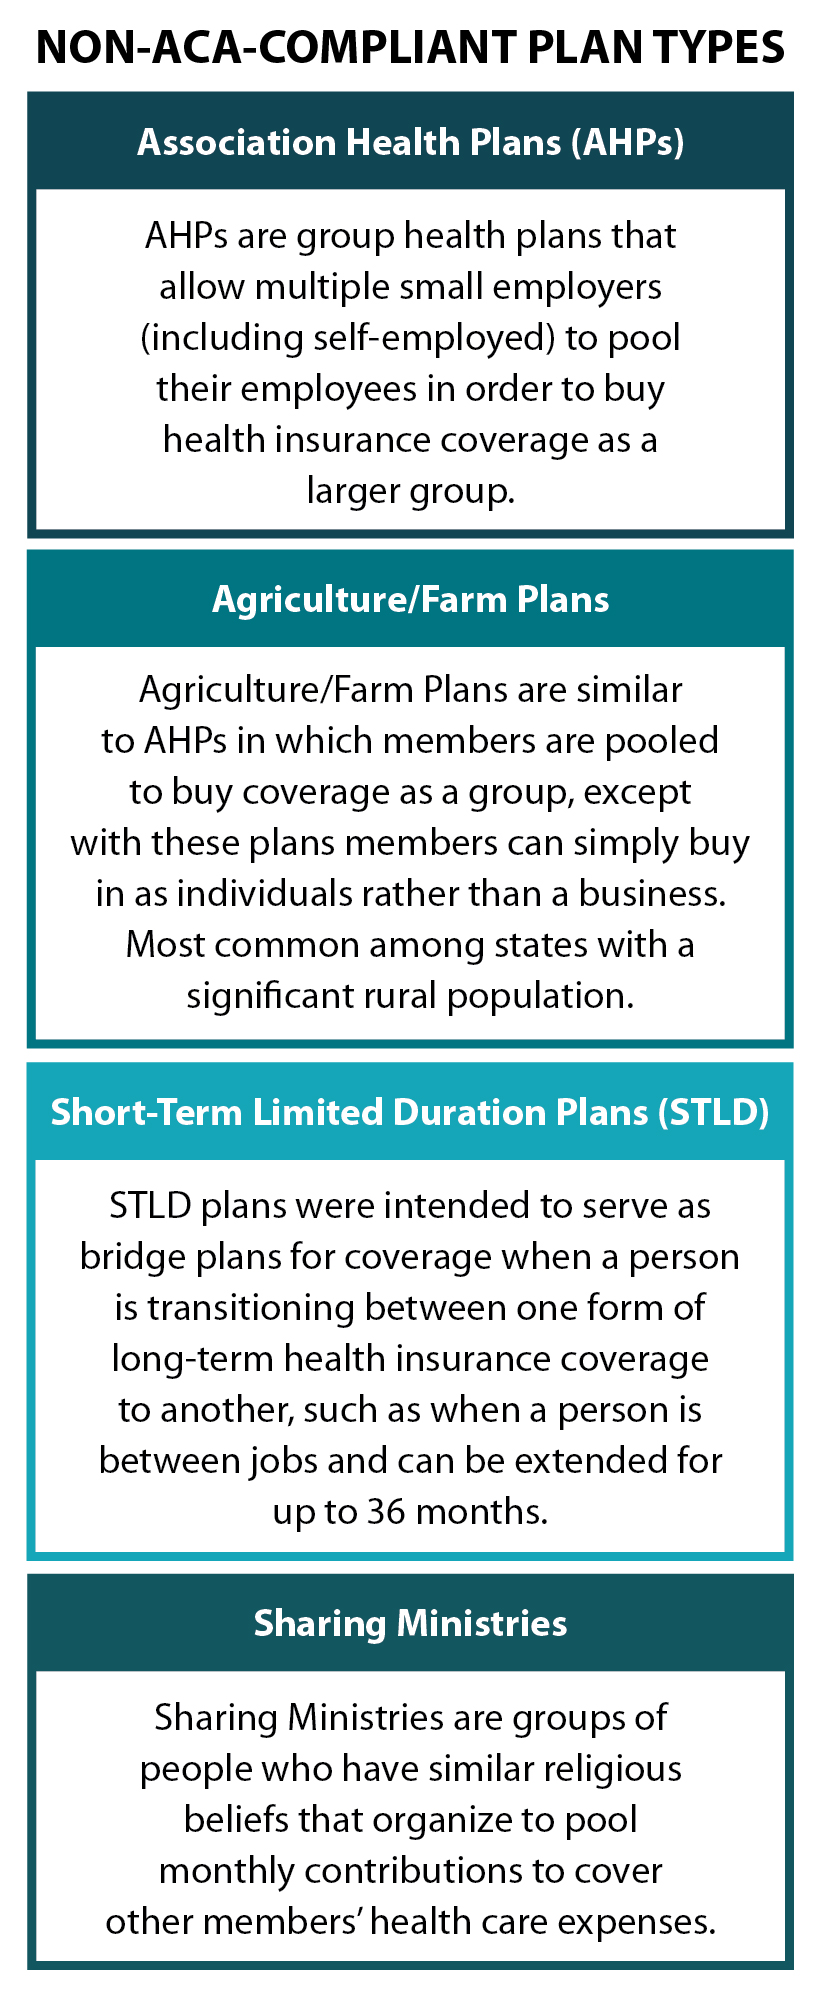 Introduction
Change is constant in the nongroup health insurance market, and both recent and forthcoming regulation changes might pose a threat to market stability. So far, these regulation changes include eliminating the individual mandate tax penalty; eliminating cost sharing payments in 2017; reducing funding for ACA navigator services; and invalidating the guarantee issue and community rating provisions of the ACA.[1]
Non-ACA-compliant health plans, which the Academy of Actuaries includes on its list of “major drivers of 2019 premium changes,” may be the greatest factor affecting market stability, however.[2] These plans include Association Health Plans (AHPs), Short-Term Limited Duration plans (STLD), Agriculture/Farm Plans, and religiously based, pre-paid coverage plans, or “Sharing Ministries.” The alternative plans are cheaper than existing products, but they are not required to cover pre-existing health conditions, to maintain minimum medical loss ratios, to cover essential health benefits, or to not discriminate in rating based on gender and health status. With the individual mandate tax penalty no longer enforced, enrollment in non-compliant plans may soon be growing more rapidly.
We investigated each of the non-ACA-compliant plan types and provide a brief description along with current estimates of enrollment or projected enrollment.
Association Health Plans
Association Health Plans (AHP) allow multiple small employers (including self-employed) to pool their employees in order to buy health insurance coverage as a larger group. In June 2018, the Labor Department finalized new rules that widen access to AHPs by greatly loosening previous requirements that ensured these groups had “bona fide” association status. The new rules allow sole proprietors and/or small businesses to band together explicitly to purchase insurance, raising concerns for both the individual and the small-group markets, which have the same set of consumer protections as the ACA-regulated individual market.
Some ACA regulations still apply to AHPs, as they are considered large-group coverage.[3] AHPs must comply with out-of-pocket maximums and cannot impose lifetime limits on coverage. However, while AHPs cannot discriminate against those with pre-existing conditions, they can set premiums based on type of employment, gender, age, and geographic location. They also are not required to cover the ten essential health benefits included in the ACA, with the exception that employers with fifteen employees or more must offer maternity benefits.[4]
Avalere estimates that 3.2 million people will move from ACA compliant plans into AHPs by 2022—1 million from the individual market and the rest from the small group market. They also estimate a resultant premium increase of 3.5 percent for those remaining in the ACA-compliant individual market, which may cause an estimated 130,000 individuals to become newly uninsured.[5]
Agriculture/Farm Bureau Plans
Several states with a significant rural population have looked for regulatory relief through a type of coverage initially targeted to famers and farm-related businesses. These Farm Bureau Plans are similar to AHPs except that members do not need to be businesses; they can simply be individuals. In some states, members do not even need to be farmers or connected with agriculture to join the association. The leading state farm bureau plans include the Farm Bureau Health Plans in Tennessee, Minnesota’s Agriculture Co-ops, and Iowa’s agriculture health plans.

Farm Bureau Health Plans (Tennessee)
Despite implementation of the ACA, Tennessee has continuously allowed its Farm Bureau to sell non-ACA-compliant plans to individuals outside of the ACA’s marketplace. These plans do not have to comply with basic ACA requirements including the mandate to provide essential health benefits and to offer coverage to individuals with pre-existing conditions. In fact, these plans are underwritten and sold just as they were pre-ACA. In the first few years post-ACA, implementation enrollees were supposed to pay the tax penalty for not enrolling in a compliant plan; however, that penalty no longer exists as a deterrent in 2019.
Tennessee’s Farm Bureau Health Plans are regulated by the state as a “not-for-profit membership organization” and are explicitly considered “not insurance.” This status exempts the Farm Bureau Health Plan from all state insurance laws and the insurance regulations adopted under the ACA.[6] The Farm Bureau Plans are underwritten and include a six- to twelve-month pre-existing condition coverage waiting period and a nine-month maternity-coverage waiting period for 2+ person families. Maternity benefits are not available in single coverage plans.
Anyone can join the Farm Bureau for a fee of just $25 a year. Farm Bureau enrollment saw rapid growth in the years since the ACA’s enactment. An estimated 73,000 individuals are enrolled in Tennessee’s Farm Bureau Plan[7] compared to the approximately 209,499 Tennesseans who purchased coverage on the health insurance exchange in 2018, 90 percent of whom received federal subsidies.[8] Tennessee has also had among the highest ACA non-group market premiums in the country.[9]

Minnesota Agriculture Cooperatives
Minnesota passed legislation in 2017 that allowed for the formation of agricultural cooperatives to operate self-funded health plans. Unlike in Tennessee, plan membership is restricted to farmers or people in the agriculture industry, ensuring they can form a true cooperative and self-insure to provide health insurance coverage to members. The farm co-op’s plans accept all who apply but are underwritten such that people with prior health conditions can be charged higher premiums.[10]
In 2018, an estimated 1,700 Minnesotans enrolled in two agricultural cooperative health plans—40 Square Cooperative Solutions and Land O’Lakes Minnesota Co-op Health Plan.[11] This was just one percent of the estimated 166,000 individuals purchasing coverage in the state’s non-group market.

Iowa Association Health Plans
Iowa passed legislation in 2018 to allow for agriculture health co-ops, but following Tennessee’s model rather than Minnesota’s. The Iowa Farm Bureau partnered with Wellmark (Blue Cross) on a new self-funded benefit plan. The state’s legislation requires that the health plan be sponsored by a local nonprofit agriculture organization and explicitly defines the plan as “not insurance,” exempting the plan from most state insurance regulation as well as regulation required under the ACA. As in Tennessee, the Iowa Farm Bureau is not restricted to the agricultural community.[12]
Iowa’s Farm Bureau products were first offered in the fall of 2018 for coverage that began in January 2019. Iowa Farm Bureau offers three health plan options, including two traditional copay or coinsurance plans and one high deductible plan with an HAS. All beneficiaries are subject to underwriting to determine the price of their plan. The Bureau estimated that about half of its current 150,000 families would sign up. They estimated that another 60,000 families may opt to join the Bureau for an annual fee of $55 in order to access its health plan.[13] If these estimates are accurate, the Farm Bureau will have enrolled more than twice the number of individuals that purchased coverage on Iowa’s health insurance exchange in 2018.[14]
Short-Term Limited Duration Plans
In February 2018, the Department of Health and Human Services proposed to broaden Americans’ ability to rely on short-term health plans that, like AHPs, circumvent the ACA’s required benefits and other protections. Short-term Limited Duration (STLD) plans were intended to serve as bridge plans for coverage when a person is transitioning between one form of long-term health insurance coverage to another, such as when a person is between jobs. In an attempt to create more affordable options in the individual market, the Administration proposed rules to allow these plans to extend coverage from the current three-month limit to up to one year, with renewal options.[15] Final rules were issued on August 1, 2018, and plans were offered in October for 2019 coverage. Despite efforts to overturn the rule through the first half of 2019, it was ultimately upheld by a federal district court judge.[16] The final rule allows for extensions of up to 36 months and includes a requirement notice that alerts consumers to the fact that the coverage does not meet the “minimum essential coverage” requirements of the ACA.
Demand for short-term plans has steadily increased since the ACA’s implementation; short-term applications accounted for 57 percent of all combined short-term and major medical plan applications received by eHealth in 2017, up from 47 percent in 2016.[17] According to the National Association of Insurance Commissioners (NAIC), there were at least 160,000 people covered by short-term policies at the end of December 2016, although the total likely exceeds that as there are no consistent reporting requirements for these types of bridge plans.
Typically, because of underwriting and the ability to exclude coverage for those with pre-existing conditions and impose lifetime limits, enrollees in STLD plans tend to be younger and healthier. Estimates vary for the projected enrollment impact of STLD plan expansion. The CMS actuary estimated that 1.7 million people would enroll in short-term plans by 2022,[18] but the Urban Institute projects 4.2 million, 9 and RAND estimates five million people would enroll.[19] Importantly, many of these projected enrollees are people who are currently uninsured—as many as 500,000 based on CMS regulatory analysis.[20]
Sharing Ministries
Sharing ministries are groups of people who have similar faith beliefs that organize to pool resources to cover members’ health care expenses. The ACA and many state statutes explicitly note that sharing ministries are “not insurance” and therefore are exempt from state and federal insurance regulations.
The sharing ministries model is similar to that of the “three-share” safety net programs, or Local Access to Care Programs (LACPs),[21] of the early 90s, wherein enrollees contribute a monthly fee to cover members’ health care costs. Because there is no transfer of risk through an insurance premium, this model is not considered traditional insurance. Typically, sharing ministry plans are locally run and may use a third party to negotiate discounted payment rates with a network of local providers. Other organizations rely on individuals to negotiate their own discounts and payment rates before they seek reimbursement from the plan.
Twenty-one states have laws saying health care sharing ministries are “not insurance.”[22] According to the Alliance of Health Care Sharing Ministries, there are 104 sharing ministries with over 960,000 members.[23] An estimated 90 percent of the ministries are Mennonite/Old German Baptist Christian associations with closed membership. Many require a signature or faith leader attestation of the member’s regular church attendance or commitment to certain religious beliefs and values.[24]
Future Enrollment Projections and Uncertainty
There are many unknowns that make projecting the impact of the non-ACA-compliant plans difficult. Health plans will make their decisions to move into this market based in part on the state regulation, restriction, or even taxation of non-compliant offerings. Based on these uncertainties, the projections of enrollment in Short-Term Limited Duration plans vary greatly, ranging from 1.7 million to 5 million projected enrollees over time, with a small proportion (500,000 based on CMS projections) being newly insured.
The projections for enrollment in Association Health Plans are also varied—Avalere estimates that 3.2 million people will move from compliant to non-compliant plans by 2022 and 130,000 individuals will be newly uninsured. In many ways the true outcome depends on additional changes made at the federal level and regulatory actions taken at the state level.
The tax penalty associated with the individual mandate has, in the past, been a deterrent to buying non-compliant plans. But now that the penalty has been repealed, states could see greater marketing and uptake of non-compliant plans.
Sources
[1] Sanger-Katz, M. (2018, June 12). The new Obamacare lawsuit could undo far more than protections for pre-existing conditions. The New York Times (The Upshot). Retrieved from http://www.nytimes.com/ 2018/06/12/upshot/the-new-obamacare-lawsuit-could-undo-far-more-than-protections-for-pre-existing-conditions.html
[2] American Academy of Actuaries. (2018). Drivers of 2019 Health Insurance Premium Changes. Issue Brief: June 2018. Retrieved from http://www.actuary.org/content/drivers-2019-health-insurance-premium-changes-1
[3] Corlette, S., Hammerquist, J., & Nakahata, P. (2018). New rules to expand association health plans [web exclusive]. The Actuary Magazine. Retrieved from https://theactuarymagazine.org/new-rules-to-expand-association-health-plans/
[4] Andrews, M. (2018). Read the fine print before picking an association plan for your small business. National Public Radio, Kaiser Health News. Retrieved from https://www.npr.org/ sections/health-shots/2018/06/27/623626154/read-the-fine-print-before-picking-bout-an-association-plan-for-your-small-busin
[5] Mendelson, D., Sloan, C., & Brooker, C. (2018). Association health plans projected to enroll 3.2m individuals. Retrieved from http://avalere.com/expertise/managed-care/insights/association-health-plans-projected-to-enroll-3.2m-individuals
[6] Henry J. Kaiser Family Foundation. (2018). Marketplace enrollment, 2014-2018. Retrieved from https://www.kff.org/health-reform/state-indicator/marketplace-enrollment-2014-2017/?currentTimeframe=0&sortModel=%7B%22colId%22:%22Location%22,%22sort%22:%22asc%22%7D
[7] Managed Care. (2017). Tennessee: individual market just barely viable–for now. Retrieved from https://www.managedcaremag.com/archives/2017/7/tennessee-individual-market-just-barely-viable-now
[8] Blumberg, L.J., Buettgens, M., & Wang, R. (2018, March 14). Updated: The potential impact of short-term limited-duration policies on insurance coverage, premiums, and federal spending. Retrieved from https://www.urban.org/sites/default/files/publication/96781/2001727_updated_finalized.pdf
[9] U.S. Office of the Assistant Secretary for Planning and Evaluation (ASPE). (2017, June 25). Individual market premiums, 2013 to 2017, by state. Retrieved from https://aspe.hhs.gov/ interactive/individual-market-premiums-2013-vs-2017-state#tab-631-2
[10] Snowbeck, C. (2017, November 14). Farmer cooperative health plans may rattle individual market in Minnesota. Star Tribune. Retrieved from http://www.startribune.com/farmer-cooperative-health-plans-may-rattle-individual-market-in-minnesota/457321193/
[11] Snowbeck, C.(2018, January 8). Farmer health plans draw 1,700 in Minnesota. Star Tribune. Retrieved from http://www.startribune.com/farmer-health-plans-draw-1-700-in-minnesota/468369493/
[12] Norris, L. (2018, June 20). Iowa health insurance marketplace: history and news of the state’s exchange. HealthInsurance.org [blog]. Retrieved from https://www.healthinsurance.org/iowa-state-health-insurance-exchange/#2019
[13] Jordon, S. (2018, April 3). Iowa Farm Bureau will sell health plans outside ‘Obamacare’ exchange. Omaha World Herald. Retrieved from http://www.omaha.com/livewellnebraska/consumer/iowa-farm-bureau-will-sell-health-plans-outside-obamacare-exchange/article_0ca98a68-9b97-54e6-a39d-81c282570442.html
[14] Henry J. Kaiser Family Foundation. (2018). Total Marketplace Enrollment [Data set]. Retrieved from https://www.kff.org/health-reform/state-indicator/total-marketplace-enrollment/?currentTimeframe=0
[15] Livingston, S. (2018, February 20). Trump administration to expand access to short-term insurance without ACA protections. Modern Healthcare. Retrieved from http://www.modernhealthcare.com/article/20180220/NEWS/180229999
[16] Keith, K. (2019, July 20).Court Upholds Rule on Short-Term Plans. Health Affairs [blog]. Retrieved from https://www.healthaffairs.org/do/10.1377/hblog20190720.616648/full/
[17] eHealth. Demand for short-term health insurance has steadily grown since implementation of the ACA [press release]. 2018. https://news.ehealthinsurance.com/news/demand-for-short-term-health-insurance-has-steadily-grown-since-implementation-of-the-aca. Published March 7, 2018. Accessed August 8, 2018.
[18] Keith, K. (2018, May 21). CMS actuary finds risk of short-term plans to be higher than estimates in proposed rule. Health Affairs [blog]. Retrieved from https://www.healthaffairs.org/do/10.1377/ hblog20180521.682815/full/
[19] Rao, P., Nowak, S.A., & Eibner, C. (2018, June 5). What is the impact on enrollment and premiums if the duration of short-term health insurance plans is increased? Retrieved from https://www.commonwealthfund.org/publications/fund-reports/2018/jun/what-impact-enrollment-and-premiums-if-duration-short-term?redirect_source=/publications/fund-reports/2018/jun/short-term-plans-enrollment
[20 Corlette, S. (2018, August 1). Short-term, limited duration insurance Final Rule: Summary and state options.Retrieved from https://www.shvs.org/short-term-limited-duration-insurance-final-rule-summary-and-state-options/
[21] Blewett, L.A., Ziegenfuss, J., & Davern, M.E. (2008). Local access to care programs (LACPs): new developments in the access to care for the uninsured. Milbank Quarterly, 86(3), 459-79. doi:10.111/j.1468-0009.2008.00529.
[22] Georgetown Center for Health Insurance Reforms (CHIR) Faculty. (2013, July 28). What do you know about health care sharing ministries? CHIR [blog]. Retrieved from http://chirblog.org/what-do-you-know-about-health-care-sharing-ministries/
[23] Alliance of Health Care Sharing Ministries. (n.d.). Purpose. Retrieved from http://www.healthcaresharing.org/about-us/#purpose. Accessed August 8, 2018.
[24] Santhanam, L. (2018, January 16). 1 million Americans pool money in religious ministries to pay for health care. Retrieved from https://www.pbs.org/newshour/health/1-million-americans-pool-money-in-religious-ministries-to-pay-for-health-care
SHADAC Expertise
Health Coverage and Access to Care
Since its inception, SHADAC has been dedicated to conducting research and providing technical assistance in order to examine characteristics of and trends in health insurance coverage and access to care and associations with overall physical, social, and mental health status. Our work on these topics includes technical briefs describing the complexity of measuring health insurance coverage and understanding the strengths and weaknesses of various data sources, e.g., federal and state-specific surveys, towards the goal of improving estimates of health insurance coverage, which is critical to the evaluation of federal and state health reform efforts. We also have conducted research studies of access to care during the coronavirus pandemic, insurance churning in Medicaid, and insurance-based discrimination. We have helped states field their own health insurance surveys or used federal data to help states target their coverage-related efforts as well as produced 50-state analyses of geographic disparities in coverage and key measures of health care access with data from State Health Compare.
Related SHADAC work
Click on any title below to learn more about the project.
Disparities in Access to Care During the Pandemic in California
This data brief examines whether and how access to care shifted during the pandemic for people with Medi-Cal, compared to those with employer coverage. Researchers compared data from the 2017–18 and 2020–21 California Health Interview Survey (CHIS). Data show that the pandemic did not widen differences in access to care for people with Medi-Cal coverage compared to those with employer coverage. among adults, there was some narrowing of differences on select measures. However, this is not a positive development, as it appears to have been caused by worsening access to care for adults with employer-sponsored insurance coverage during the pandemic rather than improvements for adults with Medi-Cal.
Minnesota’s Community and Uninsured Profile
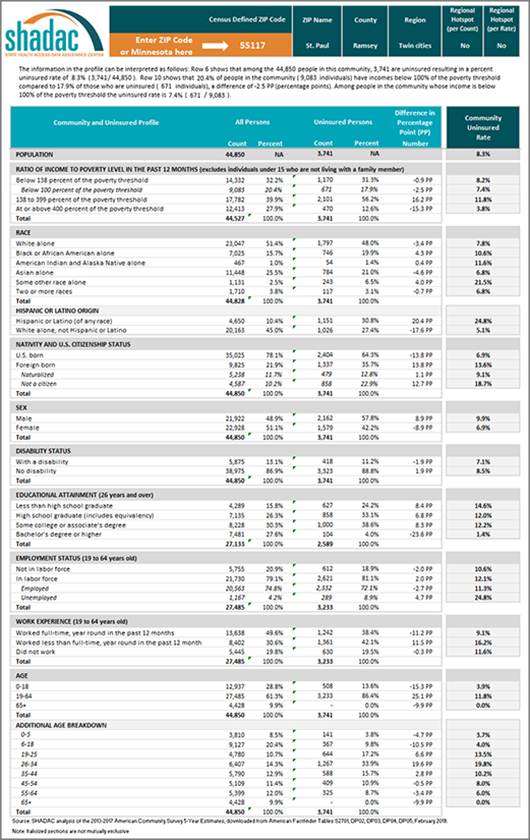
The Community and Uninsured Profile provides rates and counts of Minnesotans at a range of geographic levels using data from the American Community Survey (ACS). This resource was originally developed as part of “Minnesota’s Uninsured and the Communities in Which They Live,” a project funded by the Blue Cross Blue Shield Foundation of Minnesota that supports targeted outreach and enrollment activities of health insurance navigators and provides information about the uninsured to Minnesota policymakers as they develop strategies to reach the remaining uninsured in Minnesota. Users can explore characteristics of the total population and the uninsured population in a specific ZIP code while also overlaying in-depth community characteristics. In addition, users can look at rates and characteristics of the community and uninsured within the state as a whole, by region, county, and state legislative district. Users can also filter by MNsure rating areas -- the geographic regions health insurers use to set premiums on MNsure. You can also case studies highlighting how the profile can support the enrollment efforts of local organizations and departments in our blog on the topic here.
Telehealth Use and Experiences Among California Adults
This California Health Care Foundation (CHCF) issue brief authored by SHADAC's Senior Research Fellow Lacey Hartman uses data from the 2021 California Health Interview Survey (CHIS) to explore how telehealth use varies across subpopulations of adults in the state and reports how people rate their telehealth experience compared to in-person care. The brief concludes with a discussion of potential policy implications of the findings, and areas for future data collection and research.
Examining Gender-Based Discrimination in Health Care Access by Gender Identity in Minnesota
The biennial 2021 Minnesota Health Access Survey (MNHA) asked respondents how often their gender, sexual orientation, gender identity, or gender expression causes health care providers to treat them unfairly. We compared rates of gender-based discrimination and health care access in the Minnesota adult population and examined differences in access to care among cisgender (cis) and gender minorities who report gender-based discrimination. We explored the impact of gender-based discrimination on health care access by comparing access rates among people who did and did not experience discrimination for cis men, cis women, transgender and non-binary populations in Minnesota. Click on the title above to learn more, and read more on Sexual Orientation and Gender Identity (SOGI) discrimination in our blog here where we further examine 2021 MNHA data.
Minnesota Health Access (MNHA) Survey
The Minnesota Health Access (MNHA) Survey, conducted collaboratively between SHADAC and the Minnesota Department of Health (MDH), is a large-scale telephone and mail survey that collects information on the health of Minnesotans and how they access health insurance and health care services. The survey is conducted every two years and results are presented in a follow-up report from MDH.
Past Work
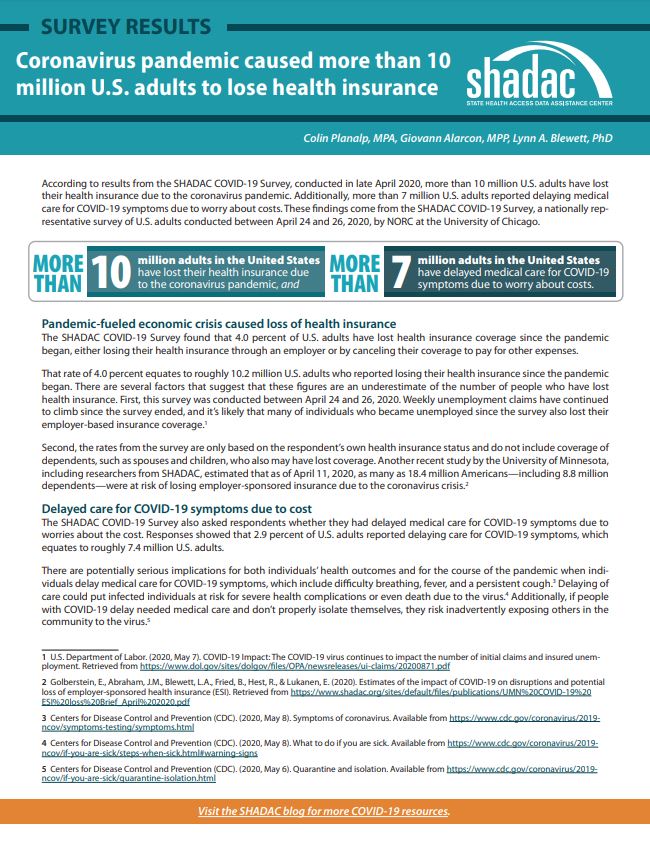
Reduced Access to Health Care due to Coronavirus Pandemic - SHADAC COVID-19 Survey
SHADAC conducted a two-part survey initially designed to measure the impacts of the novel coronavirus on a variety of experiences for adults in the United States. The survey was conducted as part of the AmeriSpeak omnibus survey conducted by NORC at the University of Chicago using a mix of phone and online modes among a nationally representative sample of 1,007 respondents age 18 and older. The first iteration of the survey was fielded in late April 2020, and questions focused on health insurance coverage, access to and cost of care during the pandemic, as well as COVID-related stressors and coping mechanisms. A second version of the survey was again fielded in April of 2021, with questions aimed at understanding respondents’ experiences with illness and death due to COVID-19 for themselves, their families, and their contacts. A collective list of products we have produced using results from the SHADAC COVID-19 Survey can be found here.
Impacts of the Affordable Care Act Medicaid Expansion in California
With funding from the California Health Care Foundation, SHADAC conducted an analysis of the impact of the Medicaid expansion on healthcare coverage, access, health status, affordability, and disparities in these outcomes by race/ethnicity for low-income Californians. Researchers on this project used nationally representative survey data from the Behavioral Risk Factor Surveillance Survey (BRFSS) 2011-2019 data years and a difference-in-differences approach that compared California with non-expansion states.
MACPAC Analysis of Insurance Churning
SHADAC conducted a quantitative analysis for MACPAC that explored the magnitude and type of churn among the Medicaid population. Specifically, the study used the Survey of Income and Program Participation Panel (SIPP) to examine the characteristics of those who churned with those who had continuous Medicaid coverage throughout the year and explored possible causes of churn. The study produced descriptive statistics to address many of the research questions and regression analysis to explore life events that potentially cause churn. The study team was able to produce state-level estimates by leveraging the large sample size of the American Community Survey (ACS) to enhance the statistical power of the SIPP by post stratifying the individual weights to match a variety of relevant population estimates in the ACS.
The Intersection of Structural Risk Factors and Insurance-based Discrimination on Healthcare Access Inequities
Social risk factors independently influence experiences of discrimination and they converge leaving some people even more vulnerable leading to worse access to healthcare. Supported by a grant from the Robert Wood Johnson Foundation (RWJF) and in collaboration with the Minnesota of Department of Health and Minnesota Department of Human Services, researchers conducted an evaluation on the effects of insurance-based discrimination and other social risk factors (e.g., low income, minority status) on disparities in access to healthcare services.
Publication
Comparing Federal Government Surveys That Count the Uninsured: 2019
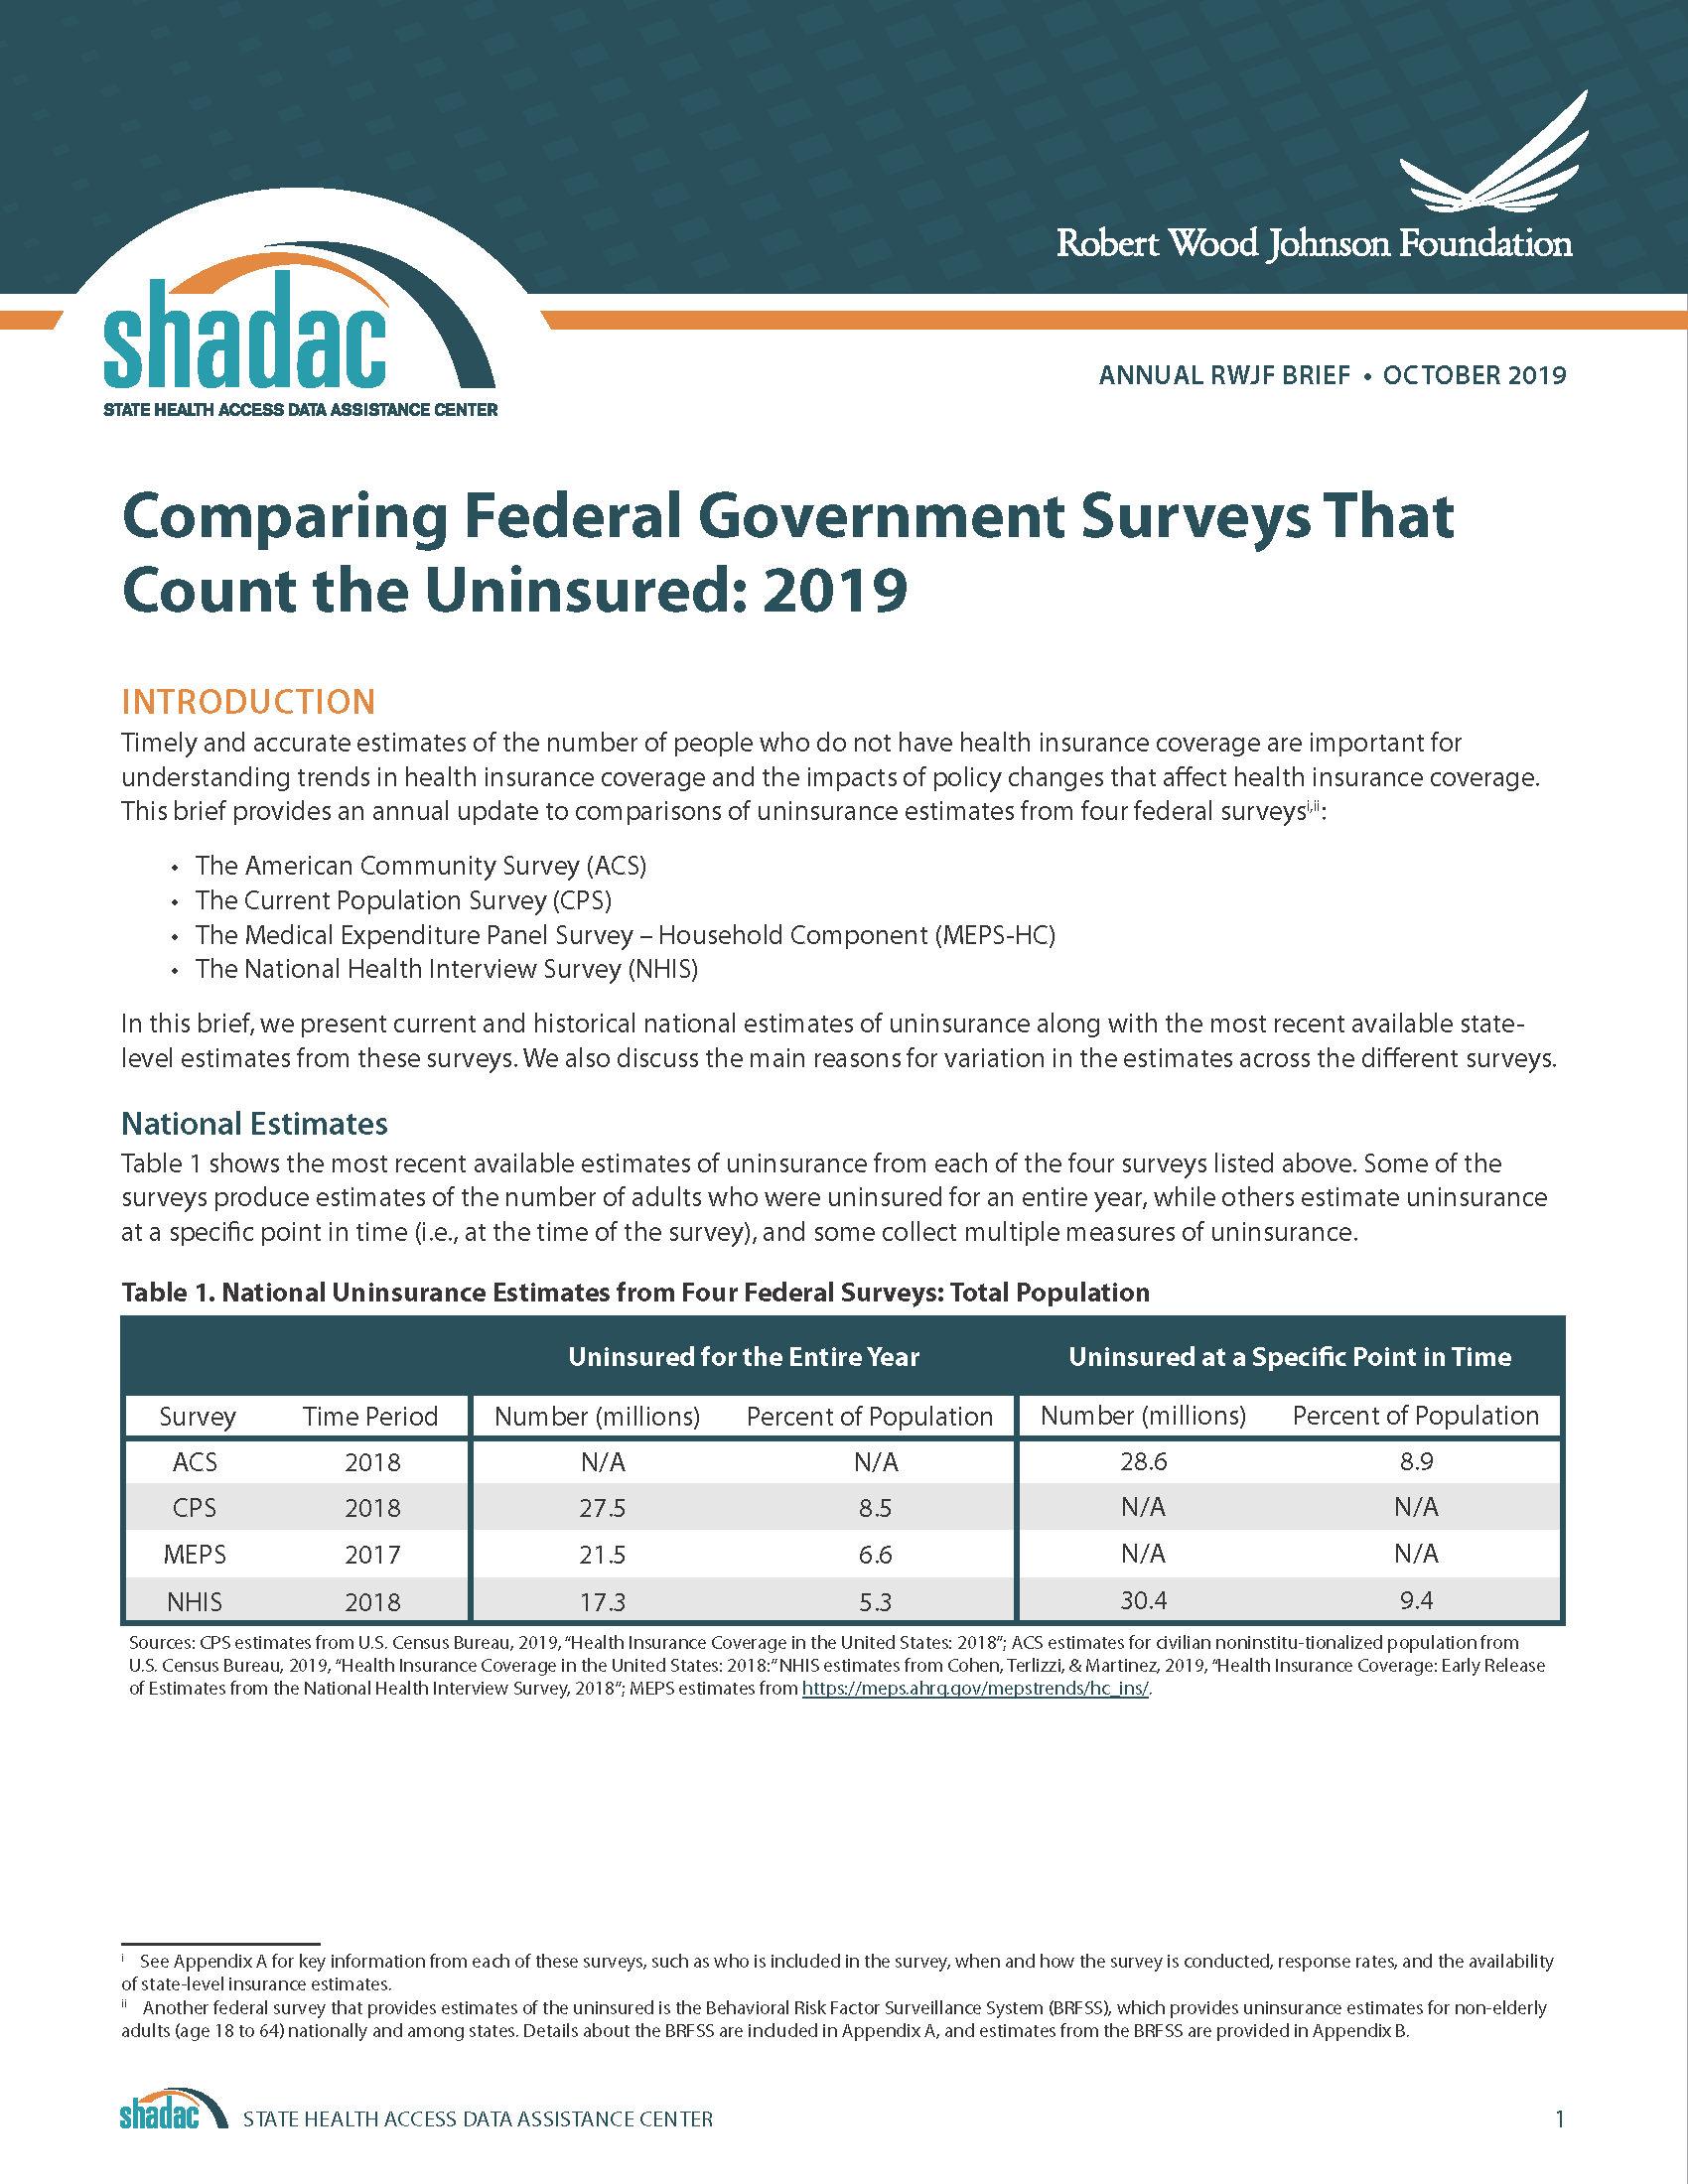 With the release of new insurance coverage estimates from surveys conducted by the U.S. Census Bureau, the Agency for Healthcare Research and Quality, and the Centers for Disease Control and Prevention, SHADAC recently updated our annual brief “Comparing Federal Government Surveys that Count the Uninsured.”
This brief provides an annual update to comparisons of uninsurance estimates from four federal surveys1:
- The American Community Survey (ACS)
- The Current Population Survey (CPS)
- The Medical Expenditure Panel Survey - Household Component (MEPS-HC)
- The National Health Interview Survey (NHIS)
In this brief, we present current and historical national estimates of uninsurance along with the most recent available state-level estimates from these surveys. We also discuss the main reasons for variation in the estimates across the different surveys.
Download a PDF of the Comparing Federal Government Surveys Brief.
Last year’s brief with data from 2017 can be accessed here.
1 Another federal survey that provides estimates of the uninsured is the Behavioral Risk Factor Surveillance System (BRFSS), which provides uninsurance estimates for the adult population 18 years and over nationally and among states.

