
Blog & News


Understanding the New CPS Processing System and New 2018 Health Insurance Coverage Estimates
November 01, 2022:On Tuesday, September 10th, the U.S. Census Bureau released estimates of income, poverty, and health insurance coverage for 2018 from two large-scale federal data surveys conducted annually and administered by the Bureau: the American Community Survey (ACS) and the Current Population Survey Annual Social and Economic Supplement (CPS ASEC). The CPS ASEC is a key source of data on poverty, health insurance coverage, health status, and medical out-of-pocket spending, in addition to a range of other economic and demographic characteristics for the United States population. For information on the ACS estimates see the recently published blog, “National Uninsurance Increased alongside Eight States; Three States Saw Decreases.”
The 2019 CPS ASEC (2018 calendar year estimates) is the first release of a “Production File” to feature a new data processing system that takes into account changes made to the health insurance questions in the 2014 CPS ASEC redesign. Changes include the addition of new variables related to types of coverage that a person held at the time of interview, Marketplace coverage, and sub-annual coverage.[1] For a detailed discussion of these changes, please see several papers produced by the Census Bureau that are available here. This blog briefly discusses the implication of the new processing system on the ability to trend estimates of health insurance coverage.
According to Census, health insurance estimates created using the new processing system should not be compared with estimates produced using the old processing system.1 Currently, the Census Bureau has released three files that that were produced using the new processing system: the 2017 CPS ASEC Research File, the 2018 CPS ASEC Bridge File, and the 2019 CPS ASEC Production File. The Census Bureau publication released this past week—“Health Insurance Coverage in the United States, 2018”—compares the calendar year 2018 health insurance estimates from the 2019 CPS ASEC Production File with the calendar year 2017 estimates from the 2018 Bridge File because both of these files use the new processing system.
The table below illustrates the importance of distinguishing between estimates of health insurance coverage produced by the old versus the new processing system.
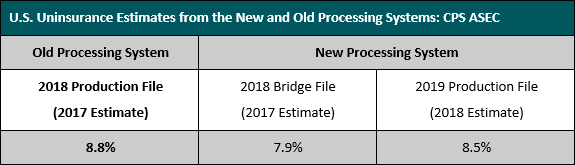
Sources: The uninsurance estimates are from “Health Insurance Coverage in the United States, 2018” and “Health Insurance Coverage in the United States, 2017”.
For example, when comparing estimates of the 2017 national uninsured rate, the old processing system (2018 Production File) produces an estimate of 8.8 percent, while the new processing system (2018 Bridge File) produces an estimate of 7.9 percent, nearly a whole percentage point lower. When examining changes in the uninsured rate between 2017 and 2018, the Census Bureau uses the 2017 estimate from the 2018 Bridge File (7.9 percent), created using the new processing system, to compare against the 2018 estimate from the 2019 Production File (8.5 percent), also created using the new processing system.
Using only estimates from data produced by the new processing system thus allows for a true apples-to-apples comparison.
[1] Notes.
New variables: The Research and Bridge Files and the 2019 CPS ASEC contain several additional variables based on new content added to the survey, including variables related to Marketplace-purchased individual coverage (i.e., if coverage was purchased from Marketplace and if the individual received a tax subsidy), concurrent coverage, and variables based on alternative definitions of medical out-of-pocket expenditures.
Sub-annual coverage: Sub-annual coverage variables (i.e., if a person was covered for none, some, or all of the previous calendar year) are available for any coverage, private coverage, government coverage, and Medicaid coverage. Sub-annual coverage data are used to determine if a person had any coverage during the calendar year. Berchick, E.R., Barnett, J.C., and Upton, R.D. (2019). Health Insurance Coverage in the United States, 2018 [Report P60-267]. Retrieved from https://www.census.gov/content/dam/Census/library/publications/2019/demo/p60-267.pdf
Blog & News
2018 ACS: National Uninsurance Increased alongside Eight States; Three States Saw Decreases (Infographic)
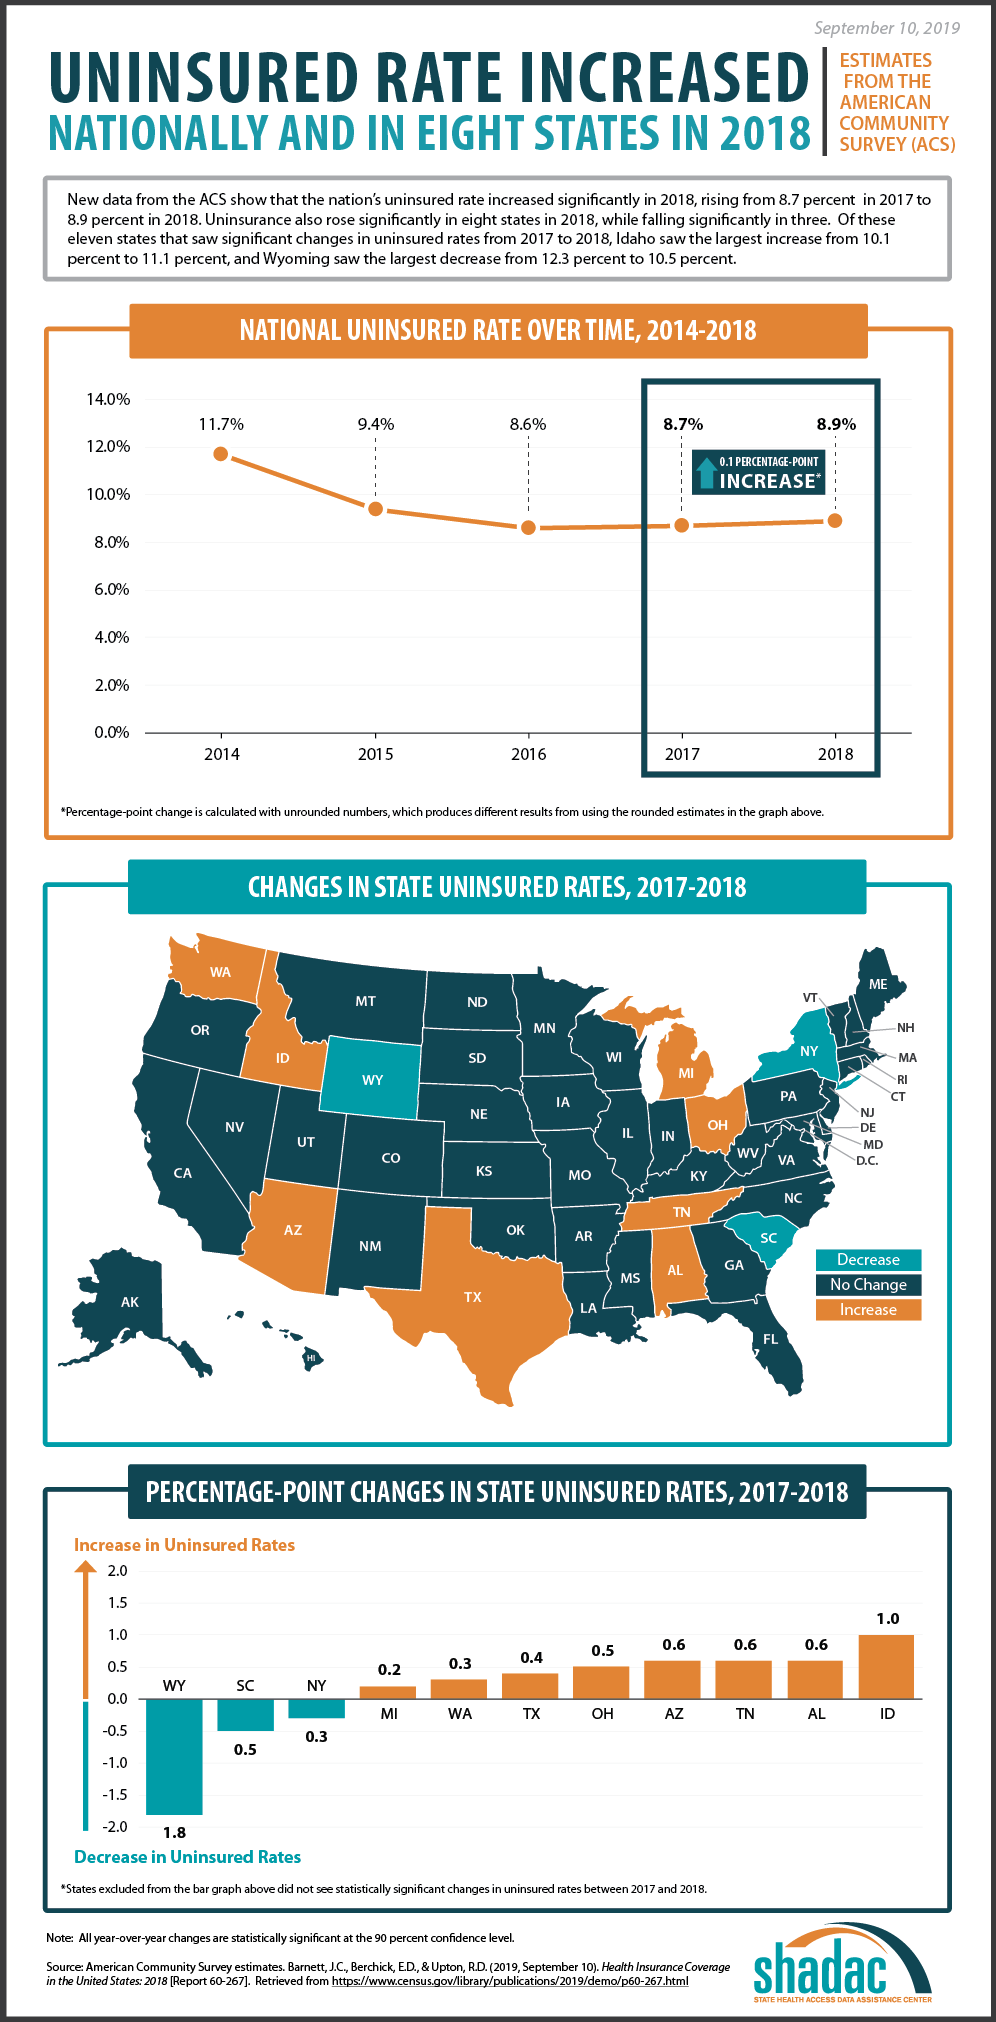
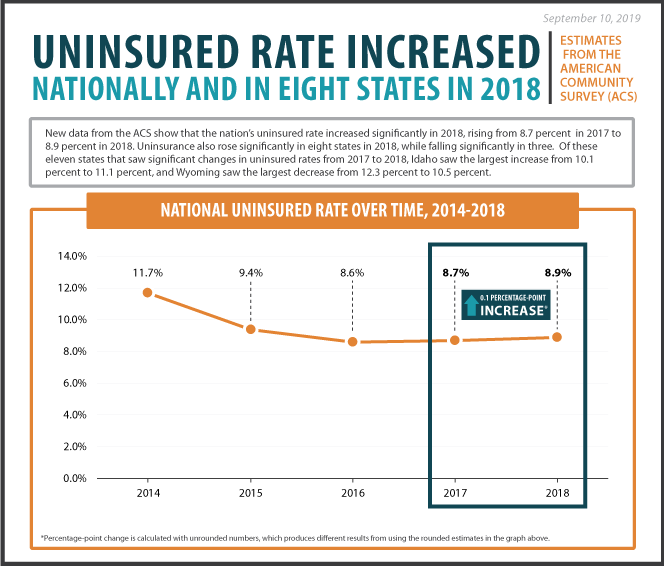
September 10, 2019:New health insurance coverage estimates from the U.S. Census Bureau’s American Community Survey (ACS) show that the rate of uninsured individuals in the United States increased by 0.1 percentage points in 2018, representing 535,000 more Americans without health insurance coverage as compared to 2017. Rates of uninsurance also increased significantly in eight states, and rates decreased significantly in just three states.
Changes in Uninsurance from 2017 to 2018
Nationally, uninsurance increased from 8.7 percent to 8.9 percent from 2017 to 2018, according to new estimates from the ACS.
Eight states saw significant increases in uninsurance from 2017 to 2018, including Alabama, Arizona, Idaho, Michigan, Ohio, Tennessee, Texas, and Washington (Table 1). Among these states, Idaho saw the largest increase in uninsurance, at 1.0 percentage points.
Michigan and Washington experienced the smallest increases in uninsurance, at 0.2 and 0.3 percentage points. 2018 increases in uninsurance in Ohio and Tennessee follow previous increases in uninsurance in these states from 2016 to 2017.
| State | 2017 Percent Uninsured | 2018 Percent Uninsured |
Percentage-Point Change, 2017-2018* |
| Idaho | 10.1 | 11.1 | 1.0 |
| Alabama | 9.4 | 10.0 | 0.6 |
| Tennessee | 9.5 | 10.1 | 0.6 |
| Arizona | 10.1 | 10.6 | 0.6 |
| Ohio | 6.0 | 6.5 | 0.5 |
| Texas | 17.3 | 17.7 | 0.4 |
| Washington | 6.1 | 6.4 | 0.3 |
| Michigan | 5.2 | 5.4 | 0.2 |
| United States | 8.7 | 8.9 | 0.1 |
| New York | 5.7 | 5.4 | -0.3 |
| South Carolina | 11.0 | 10.5 | -0.5 |
| Wyoming | 12.3 | 10.5 | -1.8 |
*Differences are calculated with unrounded numbers, which may produce different results from using the rounded values in the table.
Source. U.S. Census Bureau analysis of the American Community Survey. Health Insurance Coverage in the United States: 2018 [Report P60-267]. Table 6: Percentage of People Without Health Insurance Coverage by State: 2017 and 2018 [Excel file]. Retrieved from https://www.census.gov/data/tables/2019/demo/health-insurance/p60-267.html
Three states—New York, South Carolina, and Wyoming—each experienced statistically significant decreases in uninsurance from 2017 to 2018.
Of these states, Wyoming saw the largest drop in uninsurance at 1.8 percentage points. South Carolina also experienced a 0.5 percentage-point drop in uninsurance from 11.0 percent to 10.5 percent, reversing the significant increase experienced by the state from 2016 (10.0 percent) to 2017 (11.0 percent). New York also experienced a slightly smaller decrease of 0.3 percentage points in uninsured rates, from 5.7 percent in 2017 to 5.4 percent in 2018.
Uninsurance Levels in 2018
Texas continued to have the highest uninsured rate in 2018 at 17.7 percent—a 0.4 percentage-point increase from 17.3 percent in 2017.
The state with the lowest uninsured rate for 2018 was again Massachusetts, holding steady at 2.8 percent.
Among states that expanded Medicaid, Arizona, Michigan, Ohio, and Washington, saw increases in uninsurance, while only New York saw a decrease. State-level uninsured rates among expansion states ranged from a low of 2.8 percent in Massachusetts to a high of 12.6 percent in Alaska.
Overall, among states that did not expand Medicaid, Alabama, Idaho, Texas, and Tennessee each experienced an increase in uninsurance, while South Carolina and Wyoming experienced significant decreases. Individual state uninsured rates among non-expansion states ranged from a low of 5.5 percent in Wisconsin to a high of 17.7 percent in Texas.
SHADAC and Census Bureau Experts Will Share Insights during October 1st Webinar
On Tuesday, October 1st at 12:00 PM Central Time (1:00 PM Eastern), SHADAC will host a webinar to examine the new 2018 ACS and CPS estimates, with technical insight provided by researchers from SHADAC and from the U.S. Census Bureau, which administers both surveys.
Speakers will discuss the new national and state-level estimates, and attendees will learn:
- When to use which estimates from which survey
- How to access the estimates via Census reports and the new data.census.gov site
- How to access state-level estimates from the ACS using SHADAC tables
Attendees will have an opportunity to ask questions after the speaker presentations.
Notes
All differences described here are significant at the 90% confidence level.
All estimates are from the 2017 and 2018 American Community Surveys, as published here: https://www.census.gov/data/tables/2019/demo/health-insurance/p60-267.html
Publication
October 1st Webinar - An Annual Conversation with the U.S. Census Bureau: New Coverage Data from the ACS & CPS on the New Site for Census Bureau Data
Date: October 1, 2019
Time: 12:00 p.m. - 1:00 p.m. Central / 1:00 p.m. - 2:00 p.m. Eastern
 New 2018 data on health insurance coverage from the American Community Survey (ACS) show a nationwide increase in uninsurance from 8.7 percent in 2017 to 8.9 percent in 2018. State-level estimates within the ACS indicated uninsurance also grew significantly in eight states while decreasing significantly in just three.
SHADAC hosted a webinar on Tuesday, October 1st, examining the new 2018 health insurance coverage data from both the ACS and the Current Population Survey Annual Social and Economic Supplement (CPS ASEC), along with additional national and state-level ACS estimates of health insurance by coverage type released on Thursday, September 26th and those yet to be released on Thursday, October 17th.
SHADAC researchers were joined by experts at the U.S. Census Bureau,
which administers both the ACS and the CPS, and attendees learned about:
![]()
The new 2018 national and state coverage estimates
When to use which estimates from which survey
How to access the estimates via Census reports and the new site: data.census.gov
How to access state-level estimates from the ACS using SHADAC tables
SHADAC researchers and Census experts also answered questions from attendees after the presentation.
Slides from the webinar, as well as a transcript, are available for download.
Event Resources
2018 ACS: National Uninsurance Increased alongside Eight States; Three States Saw Decreases (SHADAC Blog and Infographic)
2018 ACS: Private Coverage Changes Split Evenly among States, Public Coverage Changes Experience Greater Variability than in 2017 (SHADAC Blog and Infographic)
SHADAC's State Health Compare (Data Dissemination Site)
2017 ACS Tables: State and County Uninsured Rates, with Comparison Year 2016 (SHADAC Resource)
U.S. Census Bureau: Health Insurance (Data Dissemination Site)
U.S. Census Bureau Health Insurance (PDF Report)
U.S. Census Bureau Statistical Testing Tool
U.S. Census Bureau Explore Census Data (Data Dissemination Site)
Blog & News
Employer-Sponsored Insurance, 2014-2018: Premiums Reach New Heights while Deductibles Hold Steady (Infographics)
August 14, 2019:More than 62 million private sector workers in the United States received health insurance benefits from their employer in 2018, and, according to SHADAC researchers, paid higher-than-ever premiums for their health plans last year. Using data from the Medical Expenditure Panel Survey-Insurance Component (MEPS-IC), a new analysis from SHADAC highlights the experiences of private sector workers with employer-sponsored insurance (ESI) from 2014 through 2018 at the national level and within the states.
Key Findings
Coverage
- Nationwide, the percentage of employers offering health insurance coverage remained steady, from 46.9 percent in 2017 to 46.8 percent in 2018.
- Employee eligibility for employer-sponsored insurance held steady as well, with a slight increase to 78.0 in 2018 from 76.8 in 2017.
- The percent of eligible U.S. employees receiving health coverage through ESI fell slightly in 2018 to 72.4 percent from 73.5 percent in 2017.
Premiums
- The average annual single-coverage premium nationwide rose $347, or 5.4 percent, to $6,715 in 2018, the largest single-year increase to date in the last five years.
- Premium increases for single coverage were also seen in 18 states and the District of Columbia, and no state saw a significant decrease in single coverage premiums.
- In 2018, the average annual family-coverage premium nationwide rose $847 to $19,565—a 4.7 percent increase from 2017.
- Family premiums for ESI also increased in 11 states, with no significant state-level decreases seen.
Deductibles
- The average annual single-coverage deductible held steady nationwide at $1,846 in 2018.
- The national average annual family-coverage deductible in 2018 also remained statistically unchanged from 2017 at $3,392.
- Among the states, eight saw increases in average deductibles for single coverage and only one (Utah) saw a significant decrease.
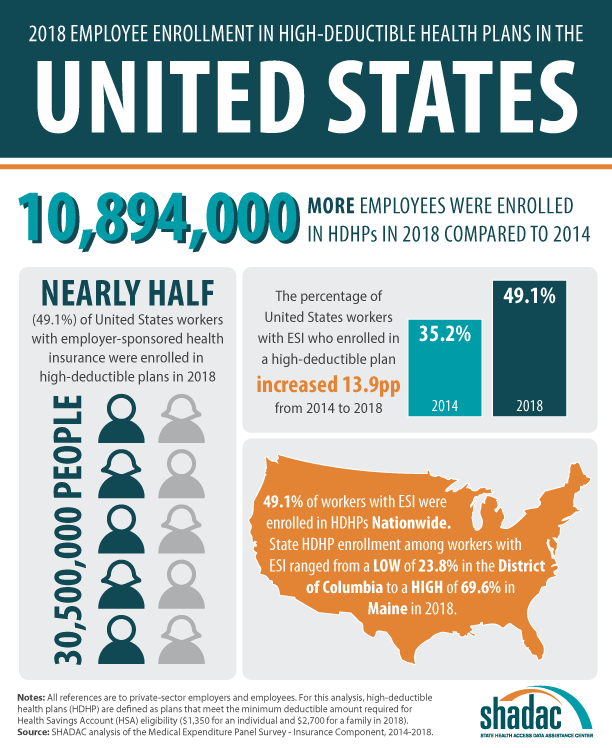
- In 2018, almost half of private-sector employees nationwide who had ESI (49.1 percent) were enrolled in a high-deductible health plan (HDHP), a rate that was unchanged from 2017 but that is 13.9 percentage points higher than in 2014 (35.2 percent).[1]
The Takeaway
As the majority of the United States population continues to receive health insurance coverage from their employer, it is important to remember that trends in ESI data such as rising premiums and continuing high enrollment in HDHPs affect a significant number of people. And while the 2018 plateau in deductible growth is heartening, it is too soon to say whether this leveling-off is actually part of a larger trend or if it’s merely a singular data point, as SHADAC’s State Health Compare estimates show average deductibles for employer-sponsored insurance more than doubling nationwide over the past 10 years.
Explore the Analysis
The following products present detailed findings from this analysis:
Interactive Map: Hover over a state on the map below to view the average annual single-coverage premium in 2018, or click a state to view and download its individual fact sheet.
| No Change in Average Annual Single-Coverage Premium in 2018 |
Significant Increase in Average Annual Single-Coverage Premium in 2018 |
|---|
Significant change between 2017 and 2018 at the 95% confidence level.
For more detailed information on ESI findings from SHADAC, see the following products:
- Report narrative highlighting key findings on levels of, and trends in: average ESI premiums and deductibles as well as employee access to and take-up of ESI coverage
- Two-page state profiles on ESI trends
- 50-state comparison data tables
About the Data
This analysis uses data from the Medical Expenditure Panel Survey-Insurance Component (MEPS-IC).
Related Resources
Now Available on State Health Compare: New and Updated Data on Measures of Availability, Cost, and Enrollment for Employer-sponsored Insurance (ESI)
SHADAC Blog
Employer-Sponsored Health Insurance at the State Level, 2013-2017: Chartbook and State Fact Sheets
SHADAC Report
Employer-Sponsored Insurance, 2013-2017: Premiums Grow Faster, Deductibles Continue to Increase
SHADAC Blog
[1] For the purposes of this analysis, high-deductible health plans are defined as plans that meet the minimum deductible amount required for Health Savings Account (HSA) eligibility ($1,350 for an individual and $2,700 for a family in 2018). This includes employees enrolled in single- and family-coverage plans.
Publication
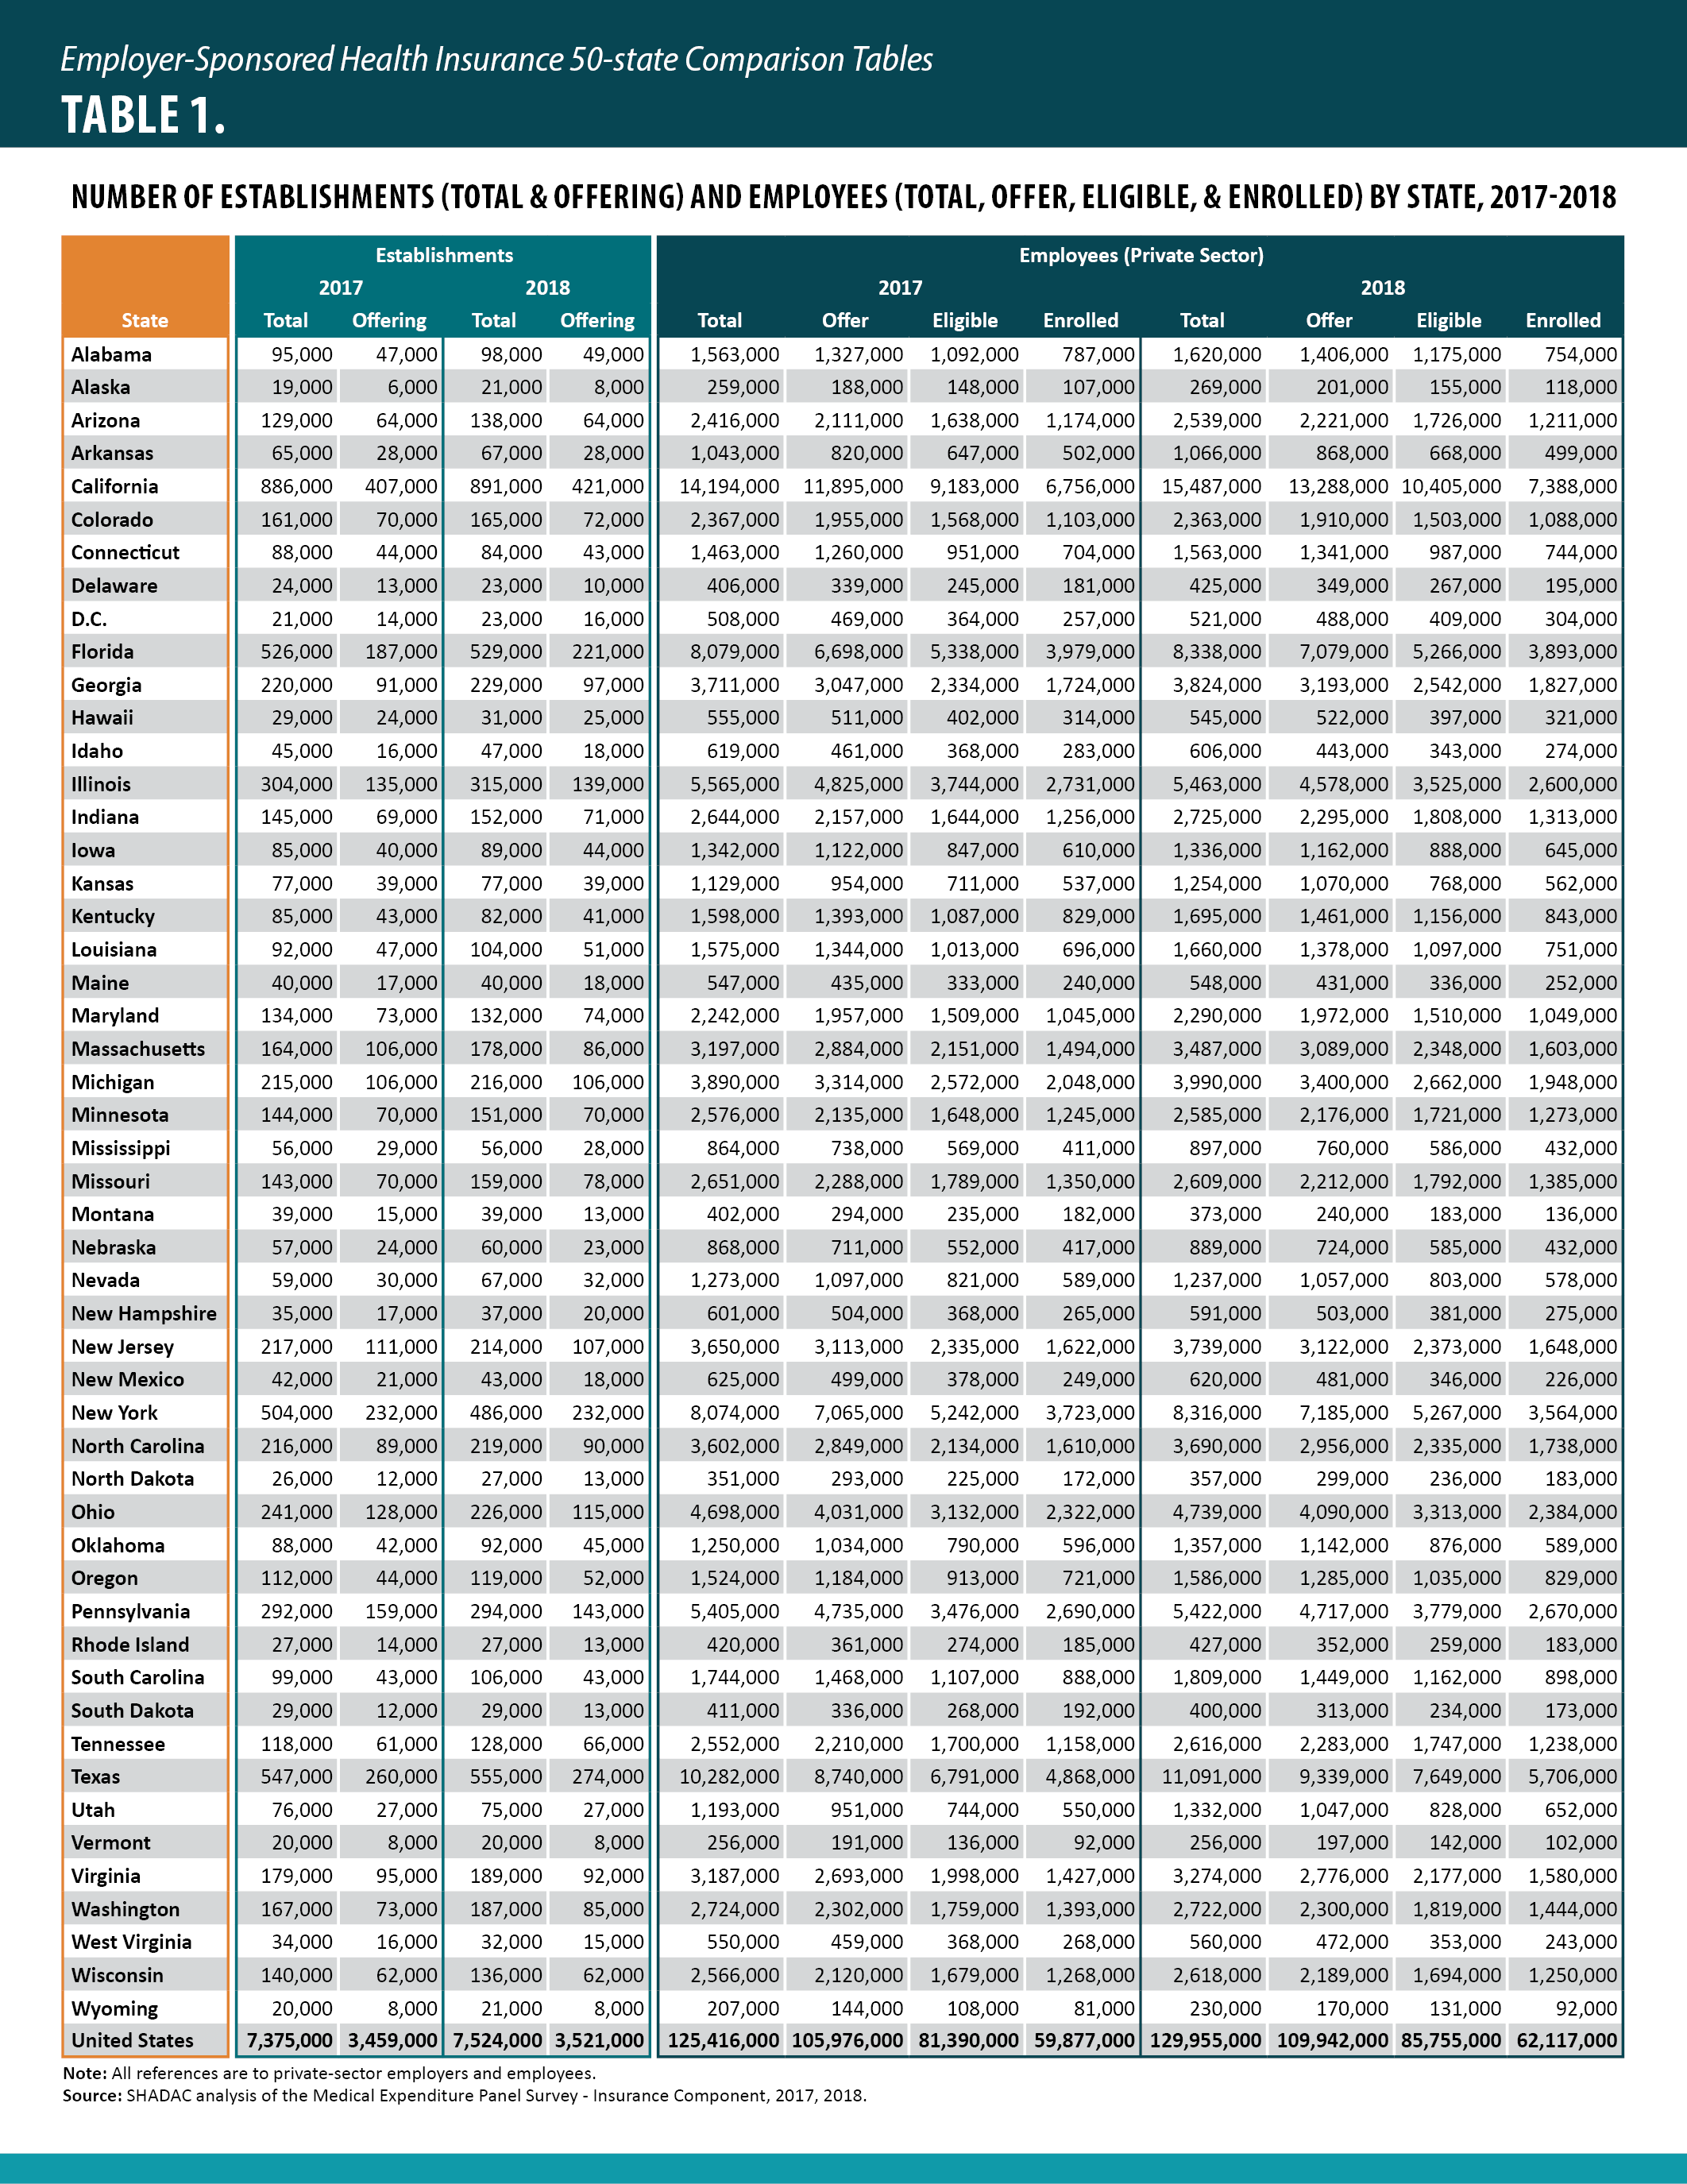
State-level Trends in Employer-sponsored Health Insurance (ESI), 2014-2018
| RESOURCES |
|
State Profiles 50-State Comparison Tables
Interactive Map |
Introduction
Health reform continues to be an ever-changing landscape, with numerous states in various stages and forms of Medicaid expansion, the fate of the Affordable Care Act as yet unknown, and politicians putting forward proposals to create new public coverage options or replace private coverage entirely. Though the future of health care may be unclear, it is important to understand the current state of affordability and access in our existing system, which, in the United States, is predominated by employment-based health insurance coverage, with more than 62 million private-sector employees enrolled in Employer-Sponsored Insurance (ESI) coverage in 2018.
To this end, SHADAC presents four related products analyzing the experiences of private-sector employees who had employer-sponsored insurance (ESI), from 2014–2018: a series of individual state profiles highlighting ESI trends, 50-state comparison data tables, a national-level infographic with an accompanying blog, and a 50-state interactive map showing levels of, and changes in, average annual premiums for single coverage in 2018. These analyses use estimates from the Medical Expenditure Panel Survey–Insurance Component (MEPS–IC), recently produced by the Agency for Healthcare Research and Quality (AHRQ).
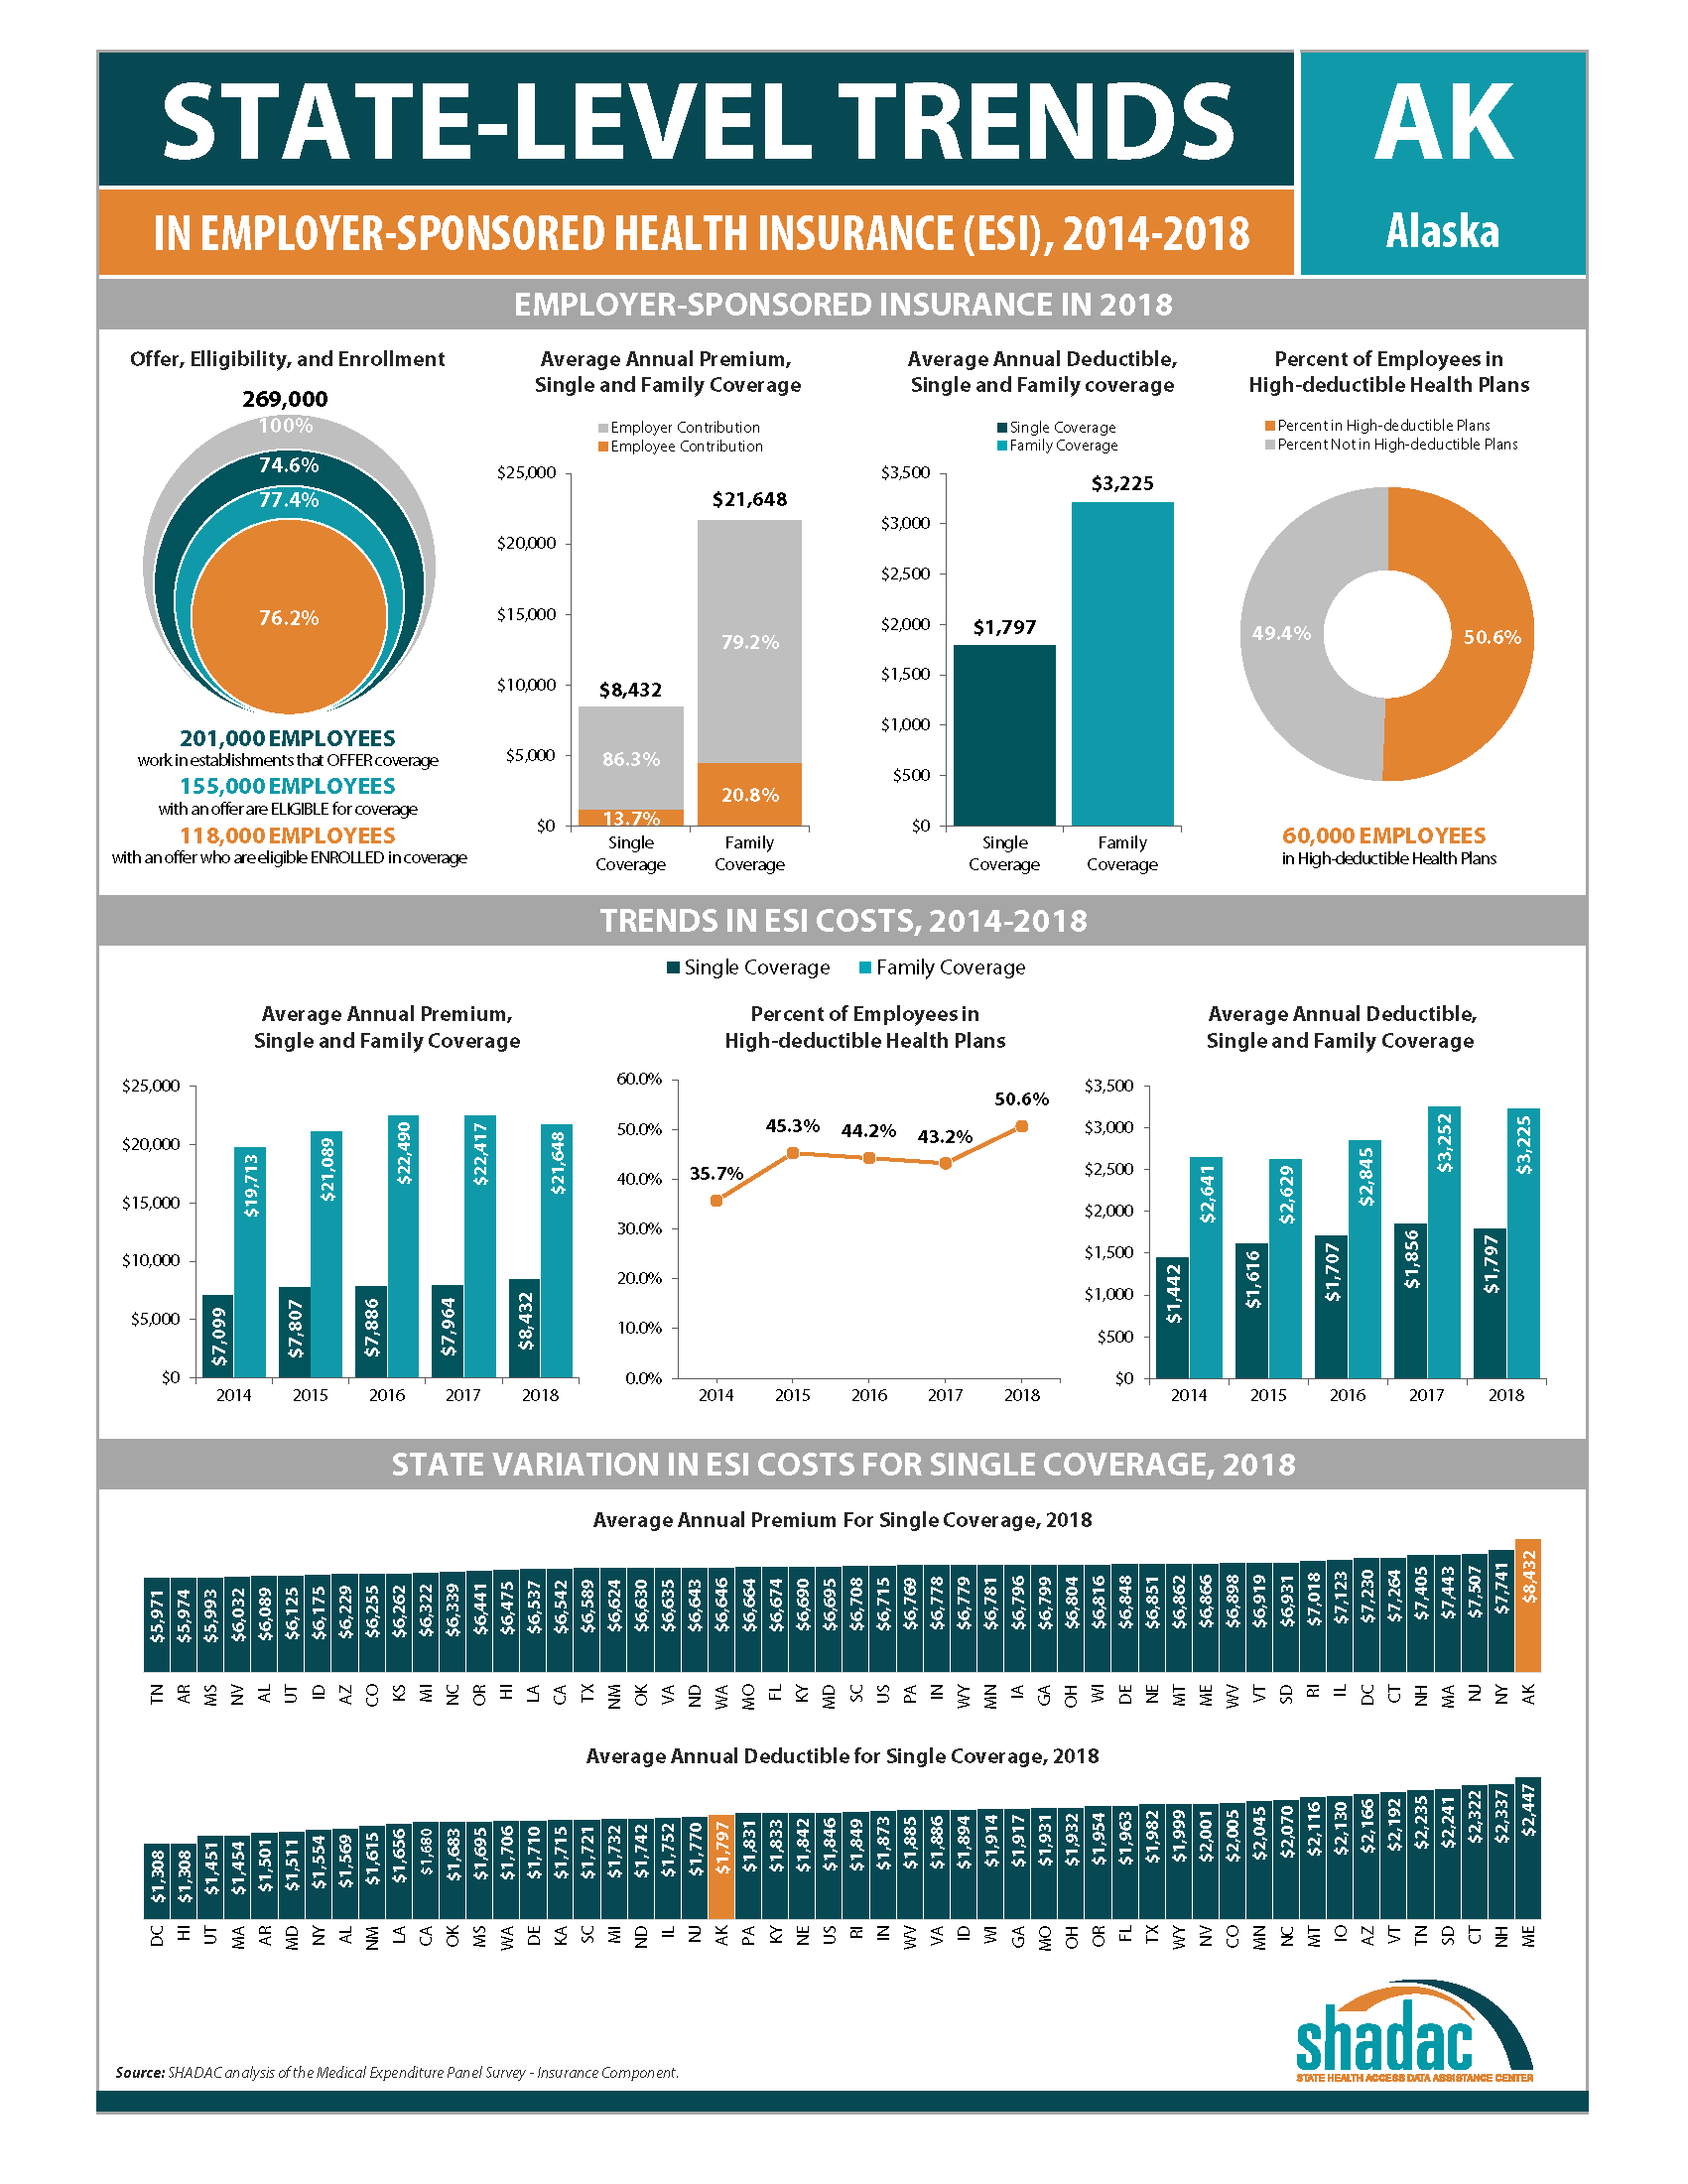
This post provides an overview of the trends in affordability of ESI coverage and employees’ access to ESI. As in previous years, ESI premiums are high and have continued their sizeable increase—the average premium for family coverage was nearly $20,000 per year in 2018. In addition, employees with ESI face substantial cost-sharing, with average annual deductibles of more than $1,800 for single coverage and nearly $3,400 for family coverage in 2018. Additionally, almost half (49.1 percent) of employees receiving ESI nationwide were enrolled in a high-deductible health plan (HDHP).[1]
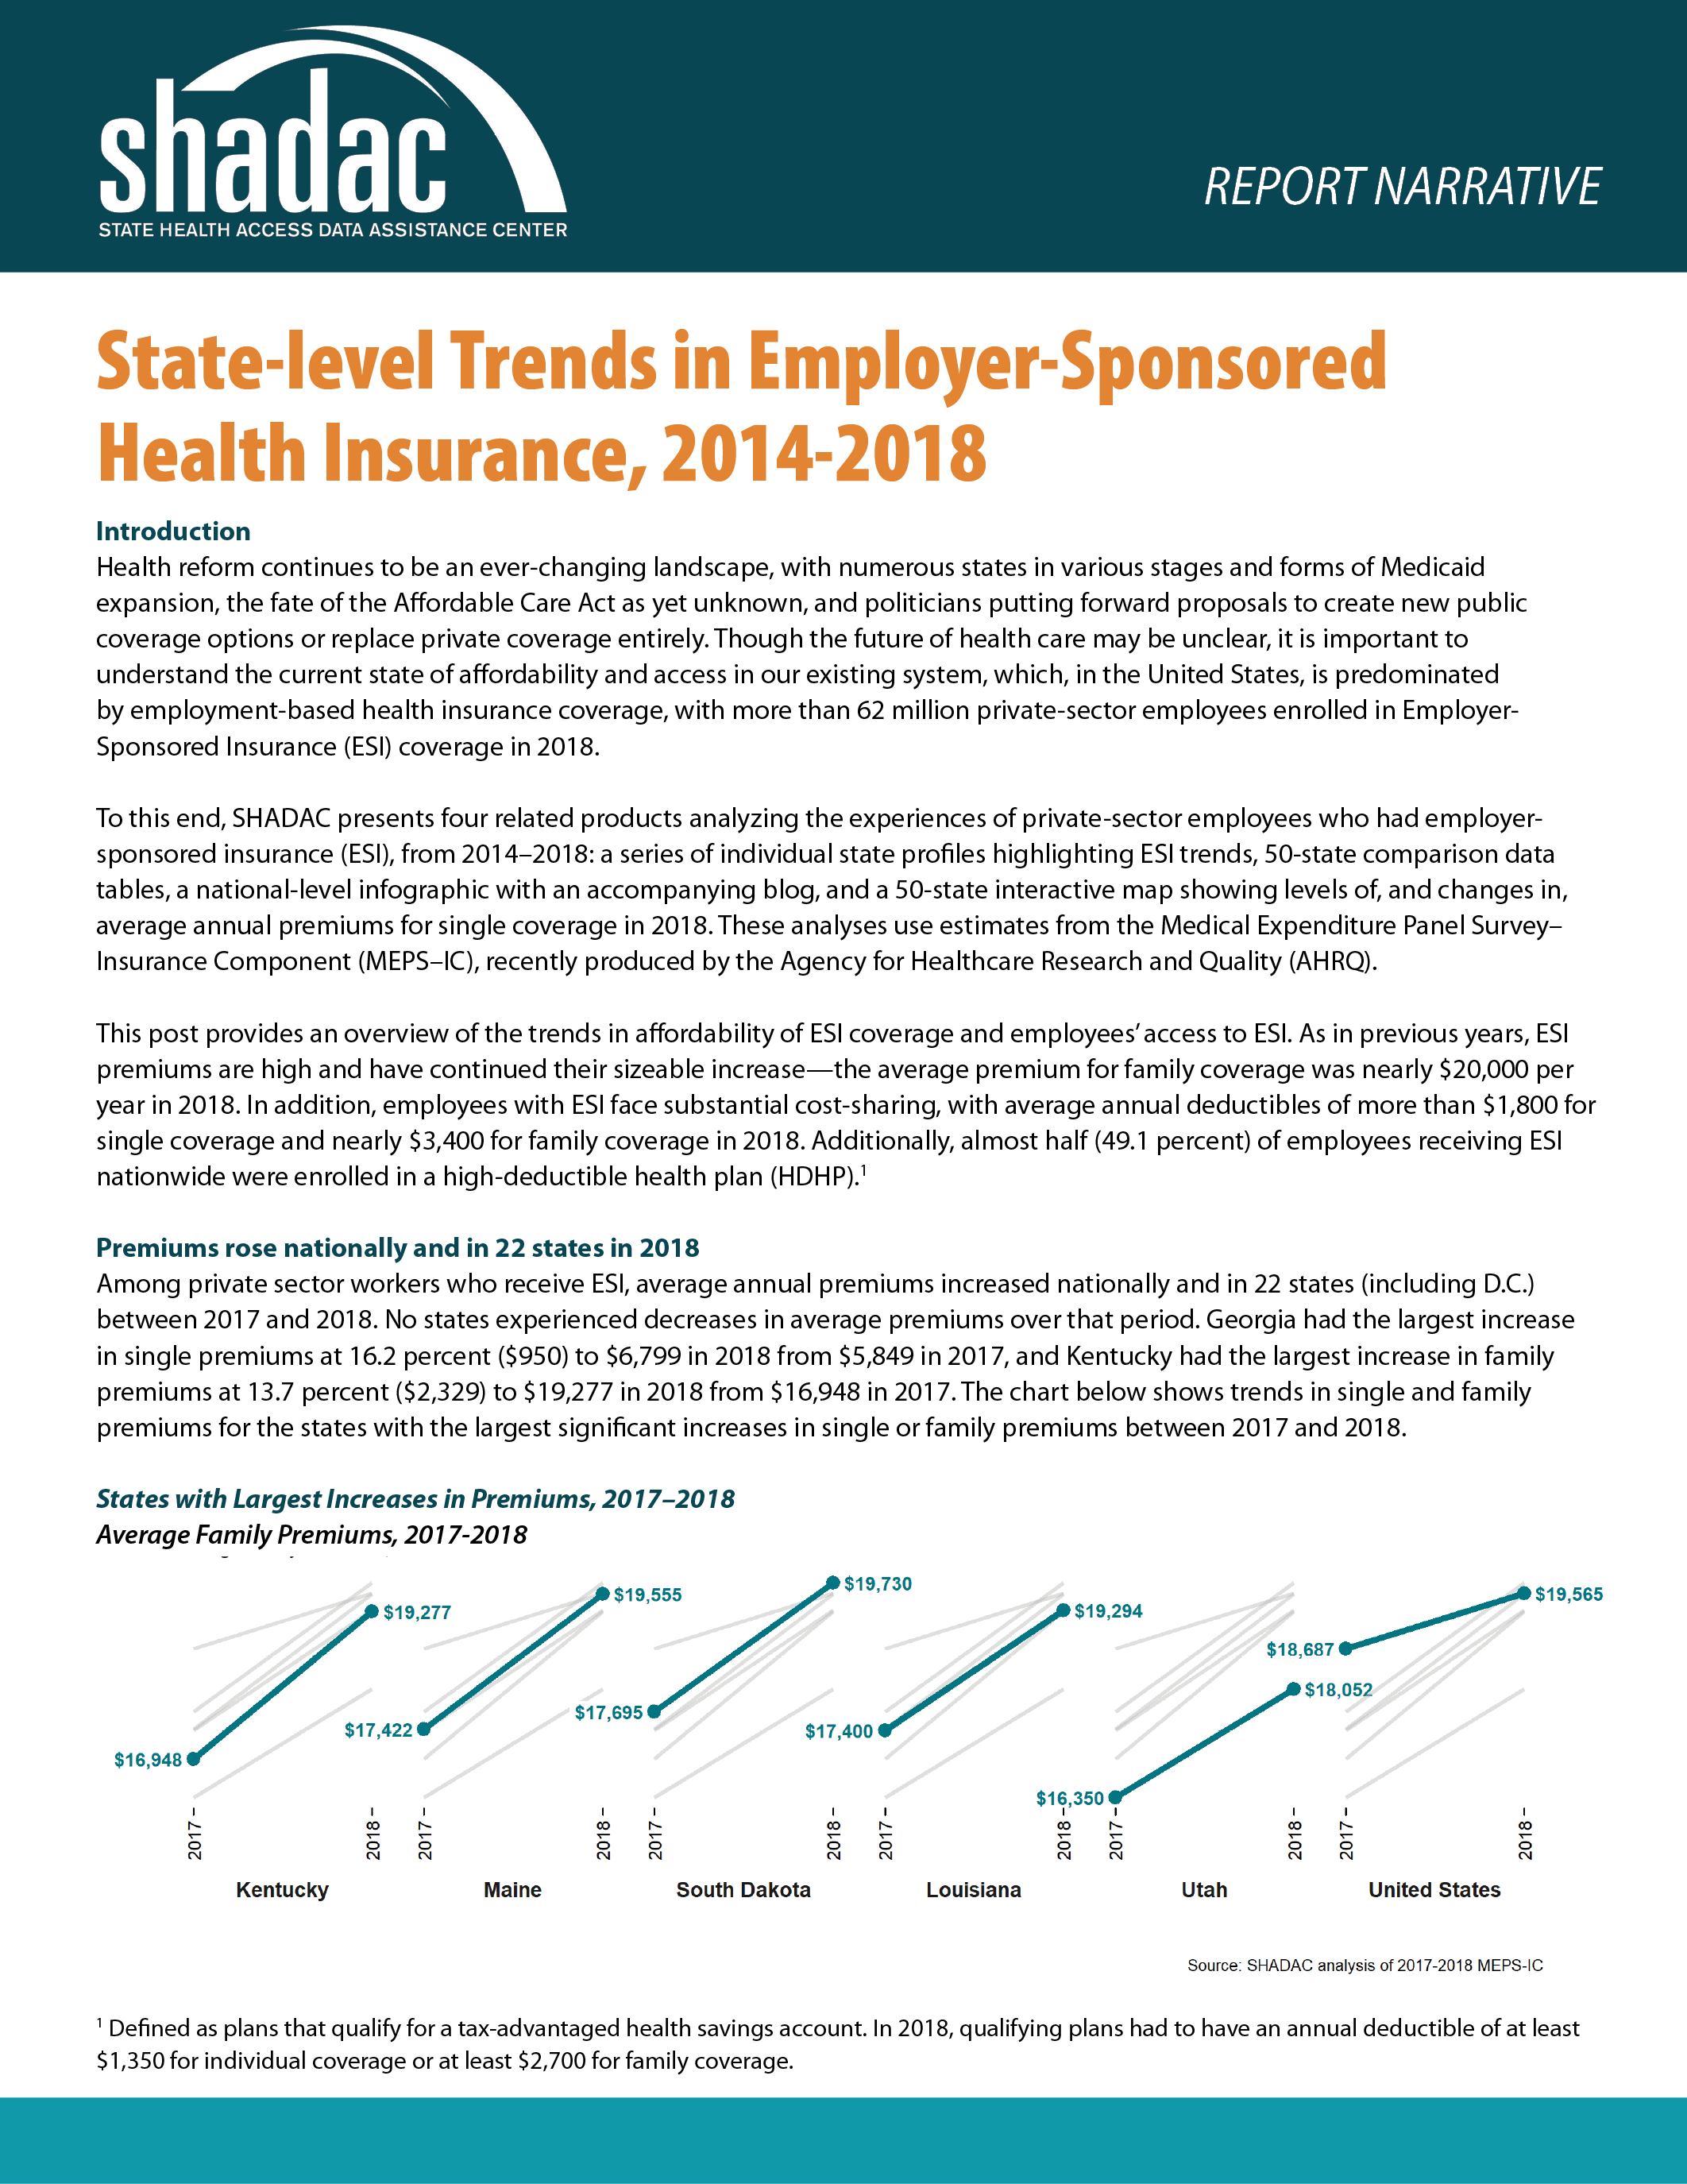
Premiums rose nationally and in 22 states in 2018
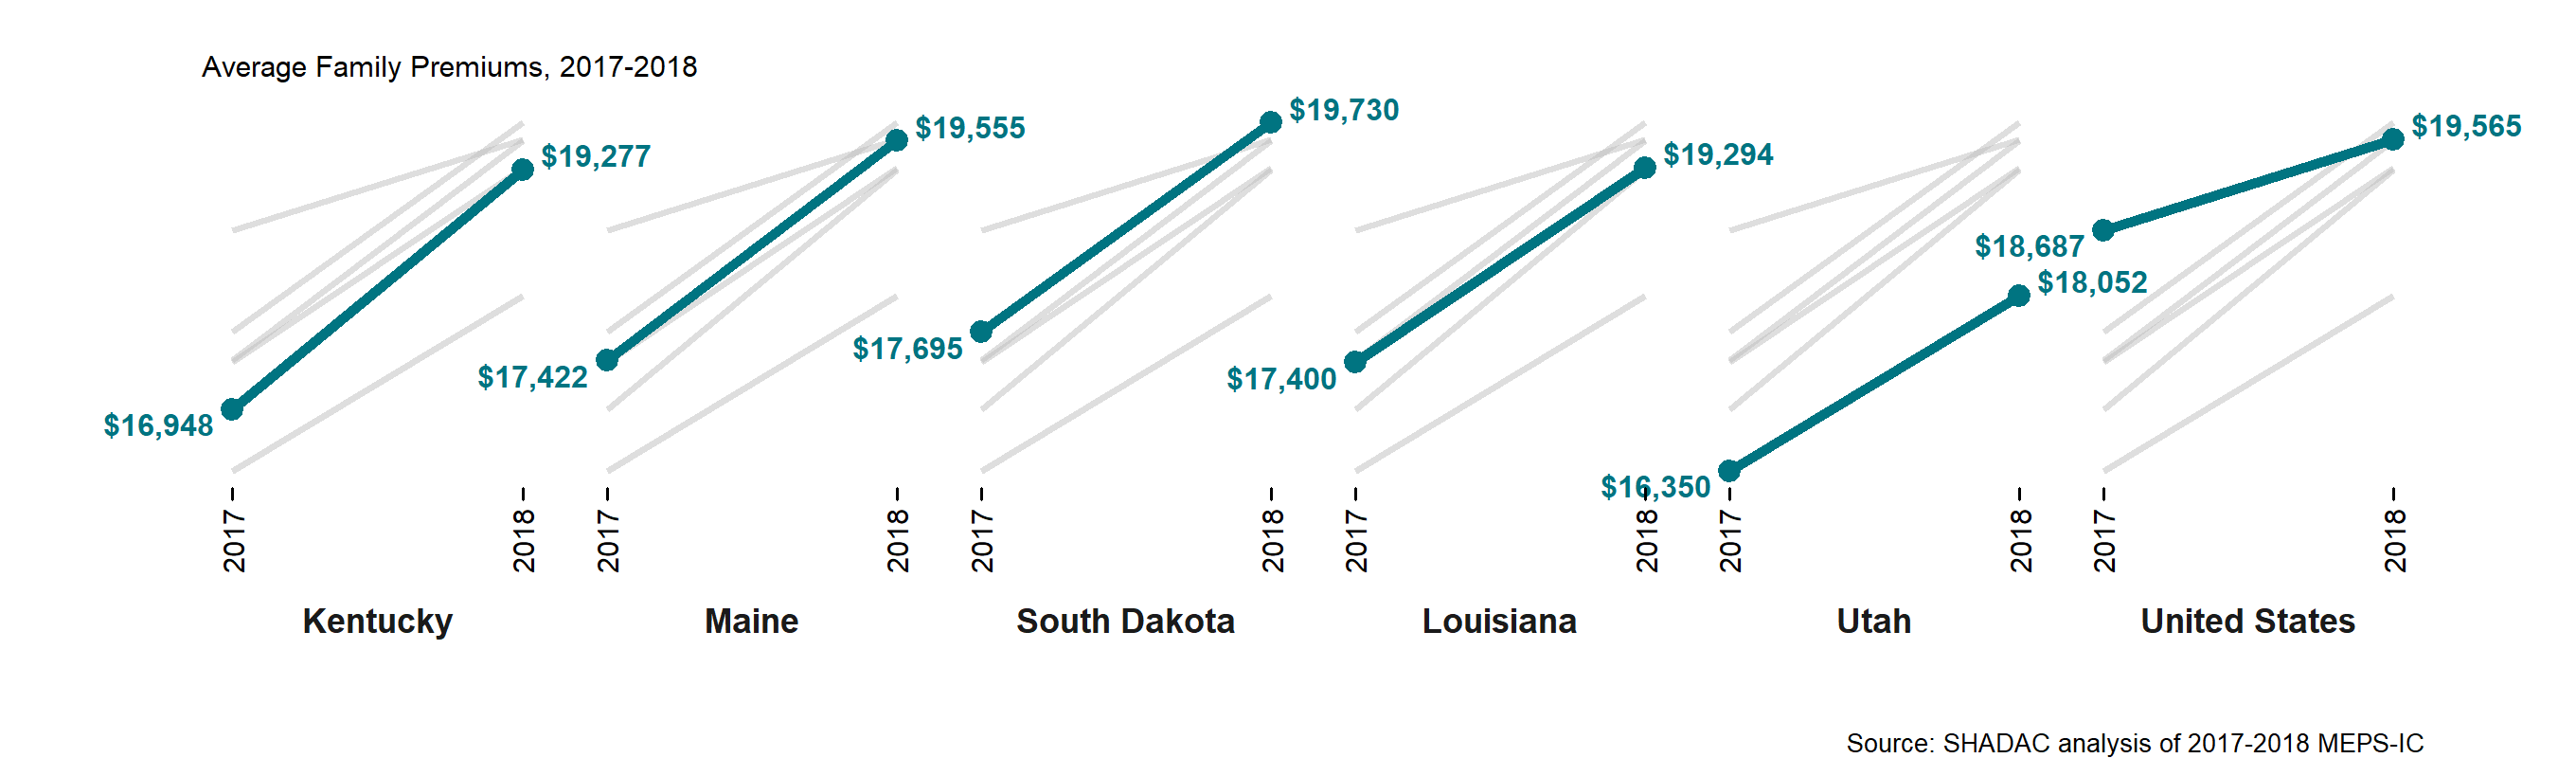
Among private sector workers who receive ESI, average annual premiums increased nationally and in 22 states (including D.C.) between 2017 and 2018. No states experienced decreases in average premiums over that period. Georgia had the largest increase in single premiums at 16.2 percent ($950) to $6,799 in 2018 from $5,849 in 2017, and Kentucky had the largest increase in family premiums at 13.7 percent ($2,329) to $19,277 in 2018 from $16,948 in 2017. The chart below shows trends in single and family premiums for the states with the largest significant increases in single or family premiums between 2017 and 2018.
States with the Largest Increases in Average Family Premiums, 2017-2018
States with the Largest Increases in Average Single Premiums, 2017-2018
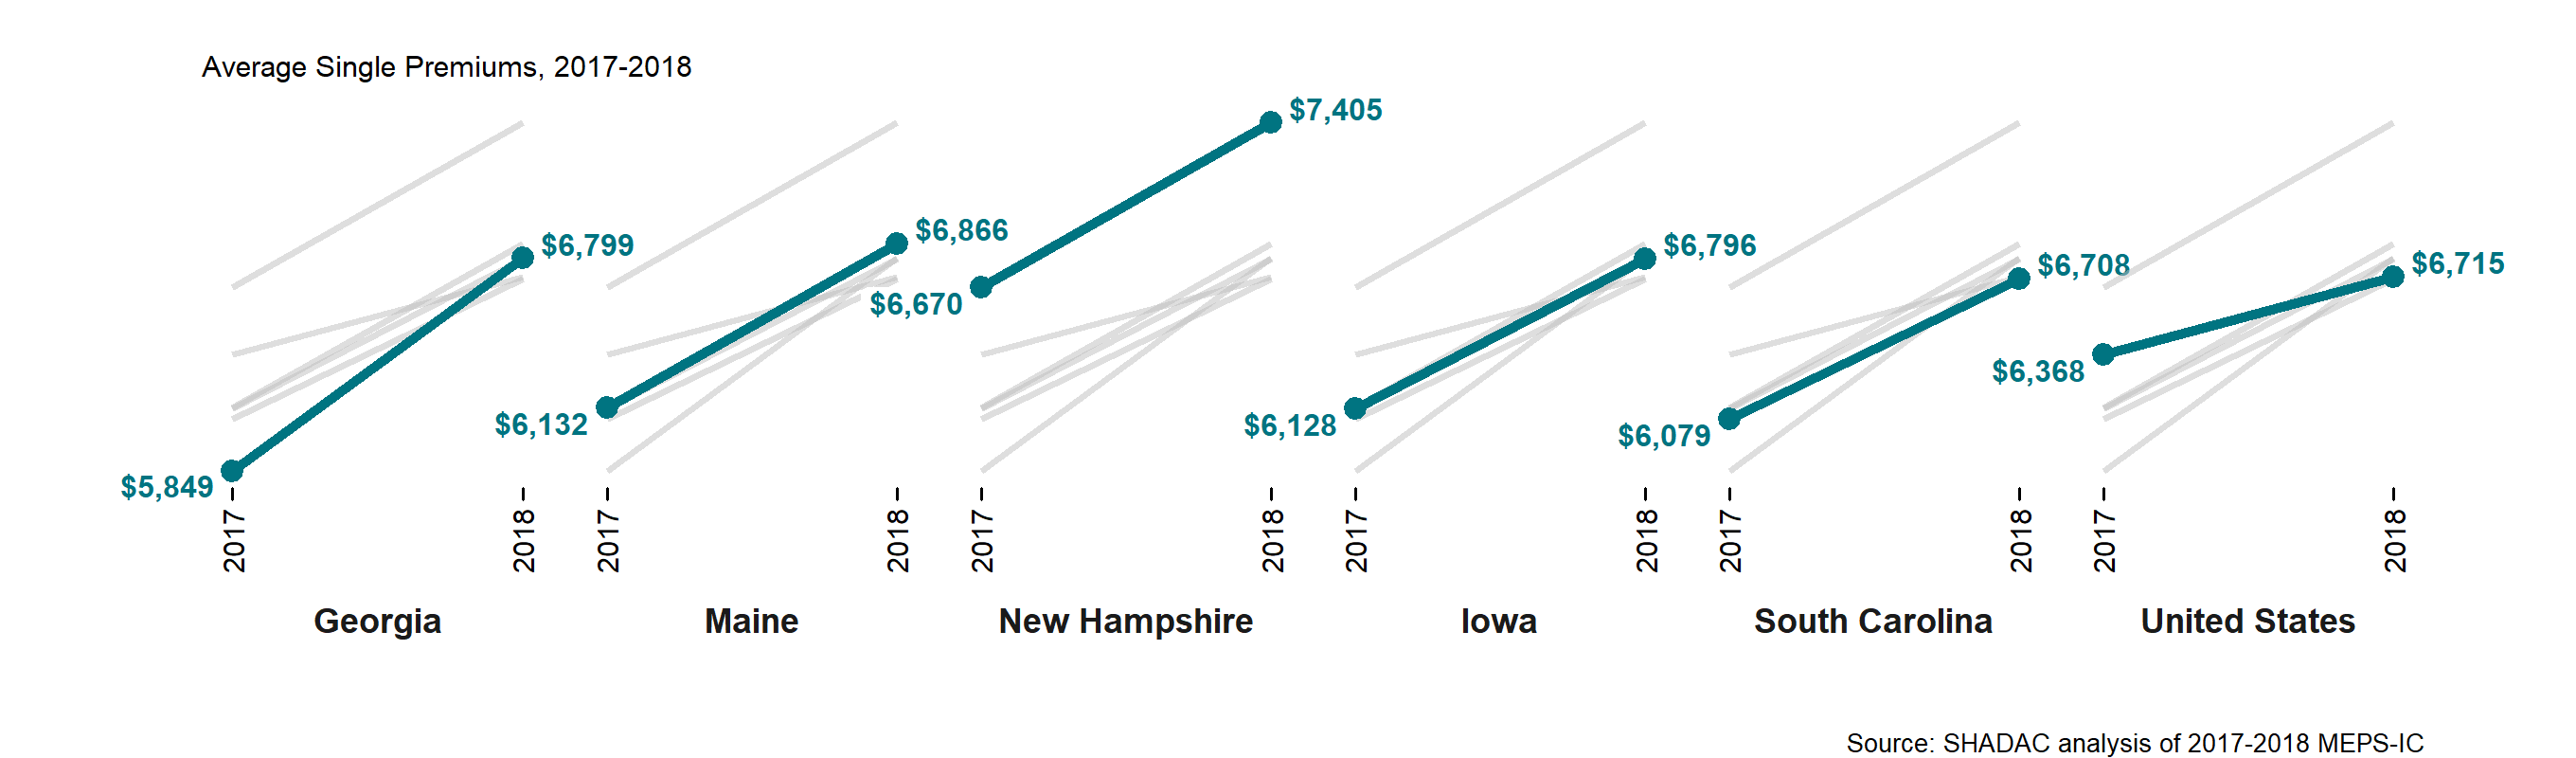 (Grey lines in the charts above allow you to compare across the 5 states with the largest increases in premiums)
Premiums also ranged significantly across the states in 2018, from $5,971 in Tennessee to $8,432 in Alaska for single coverage and from $17,337 in North Dakota to $22,294 in New Jersey for family coverage.
Deductibles were stable in 2018 but remained high
Employees with coverage through their employer continued to face large deductibles in 2018. Nationally, the average deductible reached $1,846 for individuals and $3,392 for families. Eight states saw increases in individual deductibles, and just four states saw increases in family deductibles. Average individual deductibles fell in one state (Utah), and family deductibles fell in two states (Utah and Nebraska).
Average Individual and Family Deductibles, 2014–2018
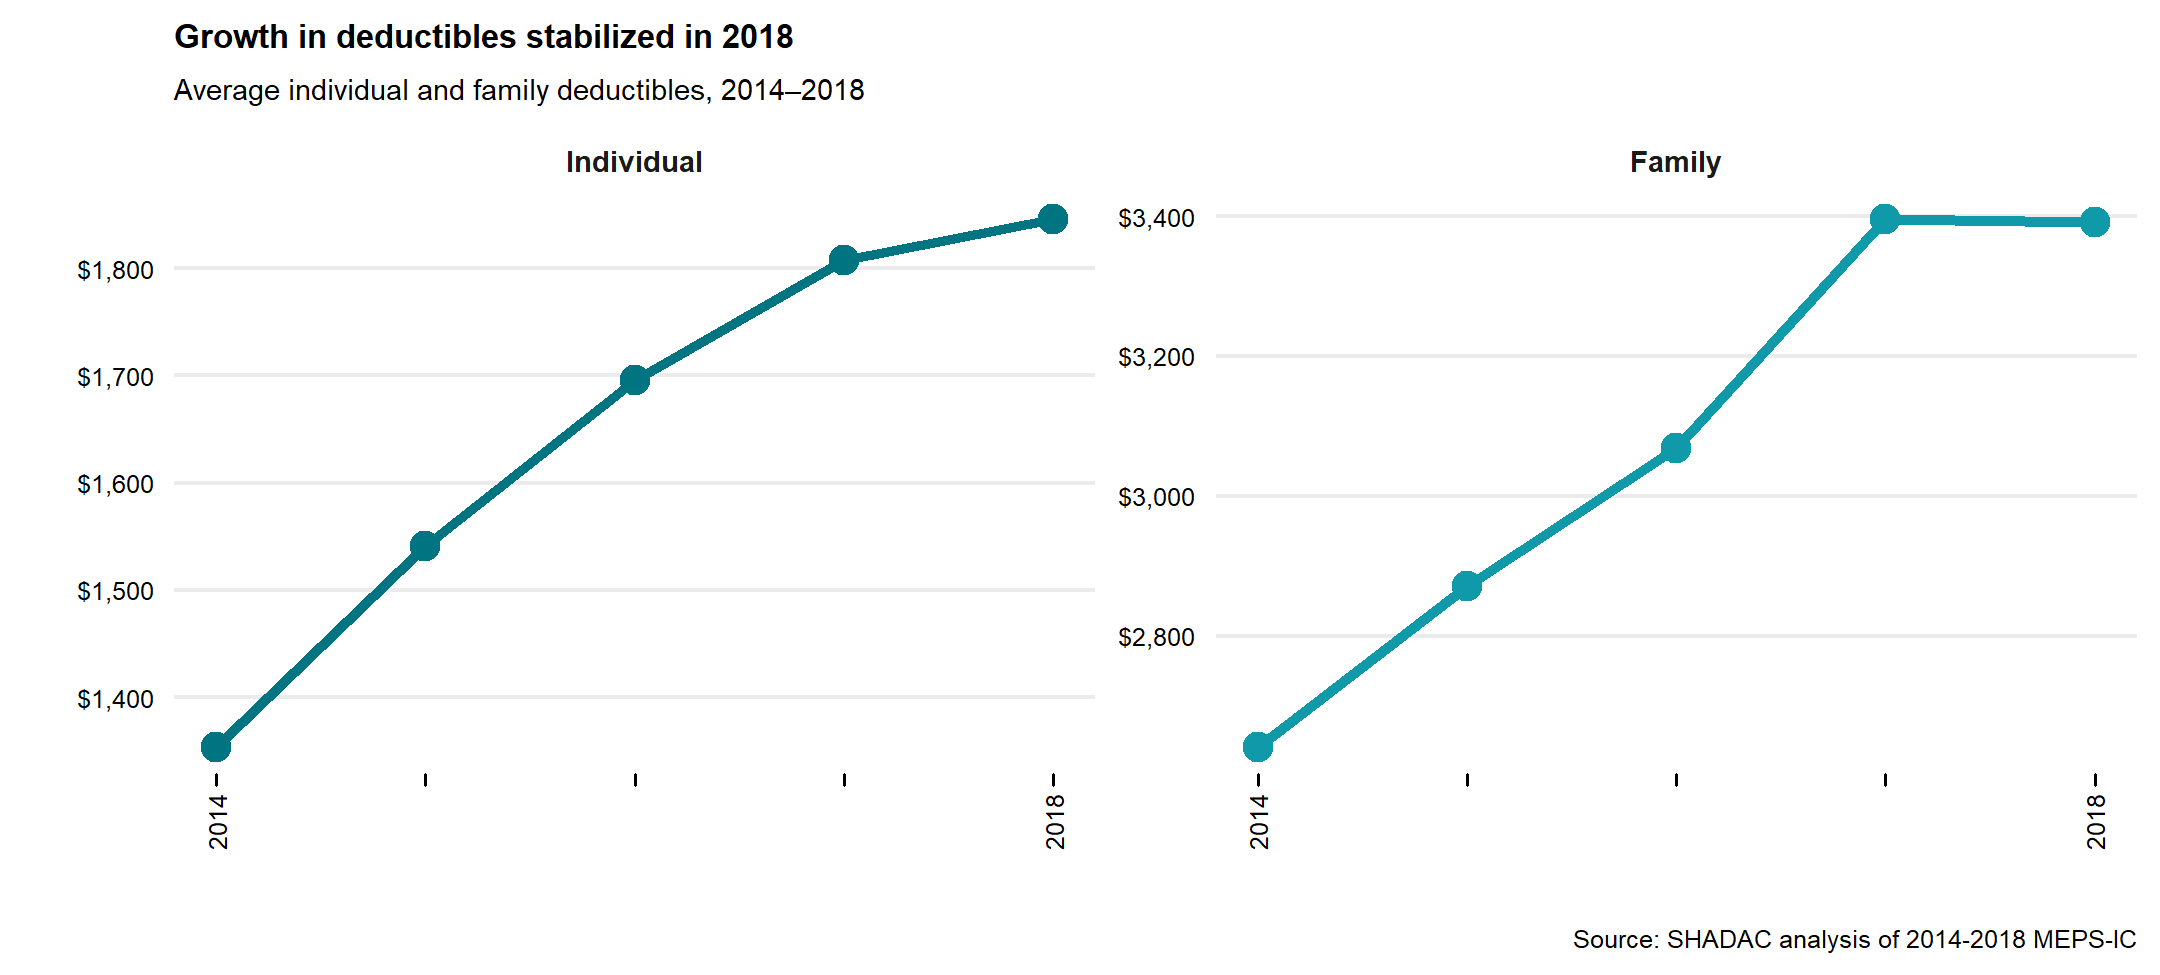
There was a great deal of variation across states in the size of deductibles, ranging from $1,308 in Hawaii and D.C. to $2,447 in Maine for individual deductibles and from $2,362 in D.C. to $4,644 in New Hampshire for family deductibles.
Overall, individual and family deductibles were stable from 2017 to 2018 at the national level—a change from previous years, which saw large year-over-year growth in deductibles. Nevertheless, it is likely too soon to say if 2018 data represents a break in the long-running growth in ESI deductibles or just a temporary pause.
The percent of employees enrolled in a high-deductible health plan (HDHP) also held steady in 2018 at 49.1 percent nationwide. HDHP enrollment increased in four states and decreased in the District of Columbia from 2017 to 2018. A majority of employees were enrolled in a HDHP in nine states.
Employees’ access to ESI coverage largely unchanged in 2018
Employee access to ESI has three components:
- Employee Offer: An employee must work in an establishment that offers coverage.
- Employee Eligibility: An employee must meet the criteria established by the employer to be eligible for coverage that is offered. (For example, the employee might have to work a minimum number of hours per pay period or complete a minimum length of service with the employer in order to be eligible.)
- Employee Take-Up: The employee must decide to enroll in—or “take up”—the offer of ESI coverage.
Less than half (46.8 percent) of private-sector establishments offered coverage to their employees in 2018, statistically unchanged from 2017.
Nationally, 85.6 percent of employees worked at an establishment that offered ESI in 2018, also statistically unchanged from 2017. This trend in employee offer rates was reflected across the states, with only no states seeing an increase, and only two states seeing a decrease (Montana and South Carolina). However, substantial variation across the states remained, with employee offer rates ranging from 64.5 percent in Montana to 95.8 percent in Hawaii.
Among employees working at an offering establishment, 78.0 percent were eligible for ESI coverage in 2018, rising a small but statistically significant amount from 76.8 percent in 2017. In 2018, three states (Alabama, Pennsylvania, and Texas) and the District of Columbia saw increases in the eligibility rate, while just one state (South Dakota) saw a decrease.
Among employees eligible for coverage, 72.4 percent enrolled in ESI in 2018, a small decrease from 73.5 percent in 2017. However, the enrollment rate was largely stable across the country from 2017 to 2018, with one state (Utah) experiencing an increase, and three states (Michigan, Oklahoma, and Pennsylvania) experiencing a decrease.
“While employers continue to offer insurance benefits to their workers, fewer are taking up that coverage and those that do are facing ever-higher premiums and steep out-of-pocket costs,” said Elizabeth Lukanen, Deputy Director of SHADAC. “Medical bills can accrue quickly and for individuals with a high deductible and little or no savings, a health crisis or chronic illness can result in major medical debt.”
Overall, while it is heartening to see stability in ESI offer from establishments as well as a potential leveling-off for deductibles, our analysis saw concerning trends in fewer employees taking up offered ESI coverage and those that do are facing ever-higher premiums and steep out-of-pocket costs.
Interactive Map
Hover over a state on the map below to view the average annual single-coverage premium in 2018, or click a state to view and download its individual fact sheet.
| No Change in Average Annual Single-Coverage Premium in 2018 |
SIgnificant Increase in Average Annual Single-Coverage Premium in 2018 |
|---|
Significant change between 2017 and 2018 at the 95% confidence level.
For more detailed information on ESI findings from SHADAC, see the following products:
- Blog post highlighting key findings at the national level regarding ESI coverage affordability and access
- Two-page state profiles on ESI trends
- 50-state comparison tables
- Download a printable version of this report narrative
Notes and Sources
Notes. All changes and differences described in this report are statistically significant at the 95 percent confidence level unless otherwise specified. This analysis and linked products only pertain to employers, establishments, and employees in the private sector. Average premium prices have not been adjusted to account for variation in actuarial value.
Sources. Data are from the 2012–2018 Medical Expenditure Panel Survey–Insurance Component (MEPS-IC), produced by the Agency for Healthcare Research and Quality (AHRQ) and are available on SHADAC’s State Health Compare web tool at statehealthcompare.shadac.org.
Additional Resources
Employer-Sponsored Health Insurance at the State Level, 2013-2017: Chartbook and State Fact Sheets
Employer-Sponsored Insurance, 2013-2017: Premiums Grow Faster, Deductibles Continue to Increase
50-State Comparison Tables: Employer-Sponsored Insurance, 2016-2017
[1] Defined as plans that qualify for a tax-advantaged health savings account. In 2018, qualifying plans had to have an annual deductible of at least $1,350 for individual coverage or at least $2,700 for family coverage.

