The National Immunization Survey (NIS) is a vital resource for understanding child and adolescent vaccination coverage rates in the U.S., as well as perceptions of vaccines and potential reasons for vaccine hesitancy. The NIS is actually a group of surveys that are conducted in a partnership between the Centers for Disease Control and Prevention (CDC)—the organization who funds the surveys and publishes the data—and NORC at the University of Chicago—the organization that has conducted survey data collection since 2005.
Specifically, the NIS group of surveys provides researchers and policymakers with data that can help to:
- Monitor trends in vaccination coverage for children and teens over time
- Inform outreach and spending to address gaps in vaccination protection
- Assess impacts of vaccination trends and policies in reducing preventable diseases
Additionally, NIS data support the CDC’s Vaccines for Children (VFC) Program, which aims to provide no cost or low-cost vaccinations to children whose parents may have difficulty affording them.
This blog will walk readers through the development and data collection methods of the NIS, how users can access the data for themselves, and provide a brief overview of the latest data available from the NIS.
The Latest NIS-Child Data (2024) Are on State Health Compare
SHADAC uses NIS-Child data to provide a measure of childhood vaccination rates on our interactive web tool, State Health Compare (SHC). While the CDC uses NIS-Child data to present rates of vaccination coverage for children by individual disease (polio, chickenpox [varicella], hepatitis A and B, etc.), SHC’s “Child Vaccination” measure uses these data to provide estimates of the percent of children age 35 months who have received all recommended vaccines. This can be especially helpful for states looking to understand what portion of their child population might be on track to receive recommended, and in some cases required, vaccinations before entering school. The data are available by race/ethnicity, coverage type, and income.
The most recent 2024 data released by the shows that vaccination coverage rates for kids held steady across the U.S. from 2023 (69.5%) to 2024 (71.0%); however, there was ample variation by state.
Explore the data for yourself on State Health Compare!
NIS Survey Background and Methods
Development of the NIS Surveys
Instead of a single survey, the NIS is actually a collection of several different, yet closely related, surveys. These surveys are conducted with regular frequency and used to obtain national, state, U.S. territory, and selected local area estimates of coverage rates for multiple vaccinations for these groups:
- U.S. children age 19–35 months (NIS-Child)
- U.S. adolescents age 13–17 years (NIS-Teen)
The NIS currently also collects specialized data about particular vaccines for specific age groups as follows:
- Influenza (flu): U.S. children age 6–18 months and 3–12 years (NIS-Child Influenza Module [CIM])
- COVID-19: U.S. adults age 18 years and older (NIS-Adult COVID Module [ACM])
The NIS also contains the NIS-Flu, which is not a separate survey, but rather a data set which consolidates estimates from the NIS-Child, NIS-Teen, and NIS-CIM to specifically track flu vaccination coverage for children and adolescents from 6 months up to 17 years old.
The NIS-Child was first launched in 1994. At that time, all operations were conducted by the CDC’s National Center for Immunization and Respiratory Diseases (NCIRD). In 2005, NORC took over data collections and still performs this function today. The NIS-Teen was launched in 2006, followed by the NIS-CIM in 2009, and the adult COVID-specific module was established in 2021.
Methodology of the NIS Surveys
All NIS survey modules are conducted by telephone via random digit dialing (RDD); this step is called the “household interview.” For the NIS-Child and NIS-Teen, a parent or guardian is asked the survey questions, answering about their child. The NIS-Child and NIS-Teen also include an optional follow-up component called the “provider record check.”
Household Interview
Supporting documentation for the most recent NIS-Child (2026) show that the household interview questionnaire contained 22 questions in total. Fifteen questions asked directly about vaccinations; for instance, when, where, and how they were received. Another three questions asked about vaccine hesitancy regarding specific illnesses, such as the flu, COVID-19, or other diseases like measles, polio, and tetanus. Two others asked if the child (as the subject of the survey) had missed any scheduled or recommended vaccinations, or if they had missed any other doctors’ visits or appointments. And the final three questions asked about any experience with or diagnosis of chickenpox or varicella illness.
Provider Record Check
As mentioned earlier, the NIS-Child and NIS-Teen both have secondary follow-up components. At the end of the household interview for these two surveys, the survey administrator will ask the parent or guardian for permission to mail a follow-up questionnaire to the child’s vaccination provider(s); this is called a “provider record check.”
If permission is given, the providers are mailed a short immunization history questionnaire (IHQ) that inquires about the types of vaccinations that have been administered, the dates of their completion, as well as the number of doses. The IHQ is then typically mailed or faxed back upon completion, though providers can complete the questionnaire by phone in some cases. Providers also have the option to send in a medical record or registry printout containing the child’s vaccination history, which is then transcribed onto the IHQ. Information provided in the IHQ is checked against and combined with parent/guardian interview answers for the most accurate information.
What Data Do NIS Surveys Collect?
All modules of the NIS collect similar demographic data, including by geography—all 50 U.S. states and the District of Columbia (D.C.), as well as territories such as Puerto Rico, the U.S. Virgin Islands, and Guam—and by categories such as age, race, ethnicity, parental education status, health insurance coverage, and poverty status. Where the various NIS surveys diverge from one another is in the collection and presentation of coverage rates for different vaccinations, which are also stratified by specific age groups.
The NIS-Child, in particular, measures rates for ten vaccinations that the CDC recommends for all children:
- Diphtheria and tetanus toxoids and acellular pertussis vaccine (DTaP/DT/DTP)
- Poliovirus vaccine (Polio)
- Measles or Measles-Mumps-Rubella vaccine (MMR)
- Hepatitis A vaccine (HepA)
- Hepatitis B vaccine (HepB)
- Varicella zoster (chickenpox) vaccine (VAR)
- Influenza vaccine (Flu)
- Haemophilus influenzae type b vaccine (Hib)
- Pneumococcal conjugate vaccine (PCV)
- Rotavirus vaccine (ROT)
When Are NIS Data Released?
Data from the NIS-Child and the NIS-Teen are released annually by the CDC; the specific release date can vary. In the past, data were released in November or December of the year following data collection (e.g., 2023 data were released in November of 2024). However, the 2024 NIS-Child data and 2024 NIS-Teen data were released in April of 2026.
Important Note: Survey Year vs. Birth Year Cohorts
One important factor that researchers should keep in mind when interpreting NIS data is that vaccination data are often presented by birth year cohorts, which lag the survey year by 24 months. In other words, data for kids born between 2021 and 2022 are collected in 2024, because that is when the majority of those children will have reached the age where they should have received the recommended vaccines. Occasionally, data will be presented by survey year, so it is crucial to pay attention to both the year the data was collected and the birth cohort of the children it includes.
Using and Accessing NIS-Child Data
In this section, we will focus specifically on accessing and using NIS-Child data.
The CDC offers a few different ways that users can access and utilize NIS-Child data. Early estimates and primary analysis of NIS data can often be found in the CDC’s Morbidity and Mortality Weekly Reports (MMWR), such as the “Vaccination Coverage by Age 24 Months Among Children Born in 2021 and 2022 — National Immunization Survey-Child, United States, 2022–2024” report, which was released on March 26, 2026, shortly before the NIS-Child data became publicly available.
Data can also be directly downloaded via Public Use Files (PUFs) on the CDC website or accessed via interactive data dashboards such as ChildVaxView, which includes data for all ages of children in the NIS-Child survey (0–35 months), and the more specialized SchoolVaxView, which shows multiple-vaccine coverage and exemption rates specifically for kindergartners across the U.S. and by state.*
NIS-Child Data Via SchoolVaxView
SchoolVaxView allows users to compare actual and “potentially achievable” vaccine coverage rates, as seen in the graph sourced from the CDC SchoolVaxView website below (Figure 1). Actual coverage refers to the current measurable vaccination coverage rate from the NIS-Child survey data, while “potentially achievable” vaccine coverage refers to the maximum vaccination coverage that could be obtained if all children with no documentation of an exemption were vaccinated.
As shown in the Figure 1 (generated by SchoolVaxView) below, the gap between potentially achievable and actual coverage varied considerably across states for the MMR vaccine for the 2024–2025 school year.
Figure 1. Actual and Potentially Achievable MMR Coverage Among Kindergartners by State, School Year 2024–2025 (via CDC SchoolVaxView)
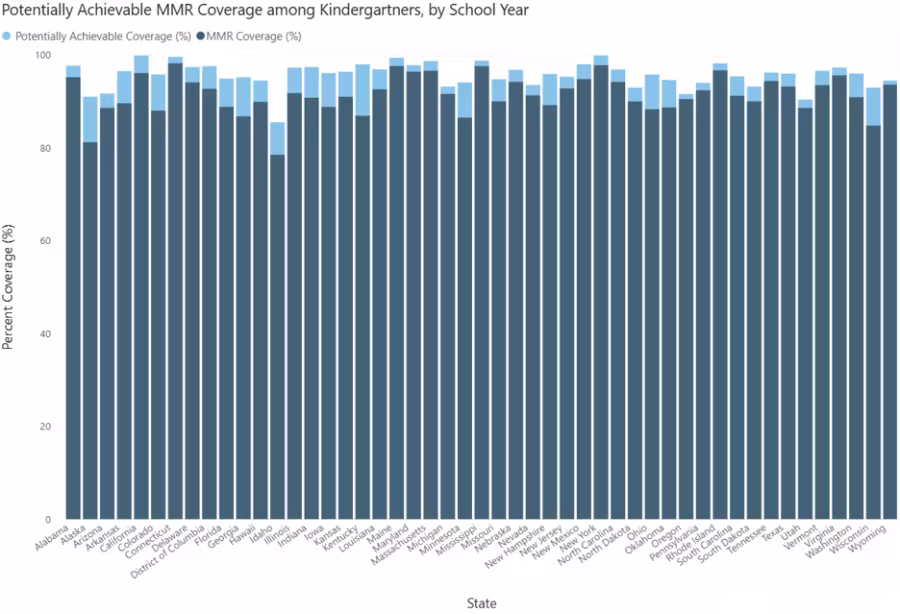
Source: SchoolVaxView Interactive. U.S. Centers for Disease Control and Prevention, National Center for Immunization and Respiratory Diseases; Immunization Services Division
NIS-Child Data Via ChildVaxView
To continue to better understand what the NIS-Child data can be used for, let’s take a closer look at a single vaccination coverage measure, influenza (flu), using the ChildVaxView tool.
In the NIS-Child, children are considered covered for their recommended influenza vaccination if they have received at least 2 doses by the age of 24 months, or 2 years old.
Through ChildVaxView, users can look at vaccination coverage rates over time by birth year. Using this dashboard, we generated the figure below (Figure 2) to show influenza coverage rates for birth cohorts from 2011 to 2022. For years, there was slow but steady growth in flu vaccination coverage rates, with the 2019 birth year cohort reaching a high of 63.8%. However, flu vaccination coverage among children dropped sharply thereafter, falling to 57.8% for the 2020 birth year cohort with continued declines in the following years. The most recent data show flu vaccination coverage measuring at 51.8% in the 2022 birth year cohort.1
Figure 2. Influenza (Flu) Vaccination Coverage by Age 24 Months by Birth Year (via CDC ChildVaxView)
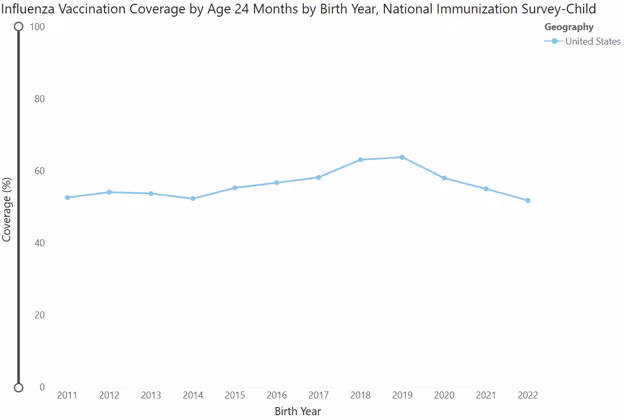
Source: ChildVaxView Interactive. U.S. Centers for Disease Control and Prevention, National Center for Immunization and Respiratory Diseases; Immunization Services Division
ChildVaxView can also show flu vaccination rates by geography, as demonstrated in the figure below (Figure 3). Flu vaccination rates for the 2022 birth cohort ranged from a low of 19.6% in Puerto Rico to a high of 80.2% in Massachusetts.
Figure 3. Influenza (Flu) Vaccination Coverage by Age 24 Months Among Children Born in 2022, Map (Via CDC ChildVaxView)
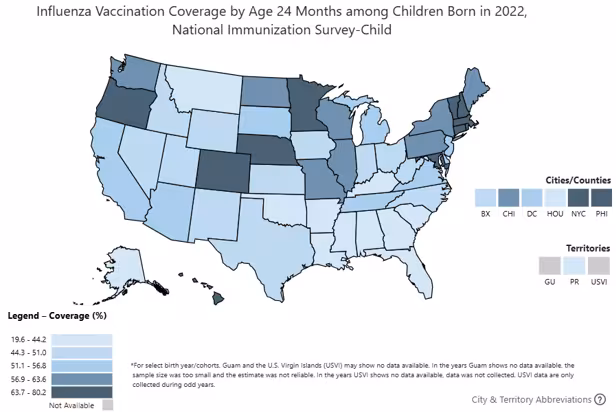
Source: ChildVaxView Interactive. U.S. Centers for Disease Control and Prevention, National Center for Immunization and Respiratory Diseases; Immunization Services Division
Understanding Vaccination Rates in the U.S. with NIS Data
Understanding flu and other vaccination data provided by the NIS group of survey can help states see how their coverage rate compares to the national average, to other states, or even to understand how their actual rate compares to their own maximum “potentially achievable” coverage rate. With this information states could target interventions accordingly, through tailored awareness and outreach campaigns using more traditional methods like providing communications packets for providers, schools, and parents; government agency press releases; or through innovative messaging campaigns that can speak directly to teens and adolescents and their families.
Along with ChildVaxView, SchoolVaxView, and other CDC resources, you can explore NIS-Child data on State Health Compare by year, state, and a number of subpopulations. Check out the measure here to learn more.
Notes
Disclaimer: Reference to specific commercial products, manufacturers, companies, or trademarks does not constitute its endorsement or recommendation by the U.S. Government, Department of Health and Human Services, or Centers for Disease Control and Prevention. SchoolVaxView and ChildVaxView interactive dashboards can be accessed on the CDC website free of charge.
[1] Birth year 2022 cohort data come from 2024 NIS survey data and preliminary 2025 NIS data.
Sources
https://www.cdc.gov/nis/about/index.html
https://www.norc.org/research/projects/national-immunization-surveys.html
https://www.cdc.gov/childvaxview/about/interactive-reports.html
Seither, R., Yusuf, O.B., Dramann, D., Calhoun, K., Mugerwa-Kasujja, A., Knighton, C.L., Kriss, J.L., Miller, R., Peacock, G. (2024, October 17). Coverage with Selected Vaccines and Exemption Rates Among Children in Kindergarten — United States, 2023–24 School Year. MMWR, 3(41);925–932. https://www.cdc.gov/mmwr/volumes/73/wr/mm7341a3.htm