
Uninsurance rose 0.4 percentage points nationally among the nonelderly, with increases in almost half of states
The U.S. Census Bureau released health insurance estimates from its 2025 American Community Survey on October 29, 2026.
While the data show a statistically significant increase in uninsurance since 2024, the Census Bureau urges caution in comparing these latest 2025 ACS data against prior years of data. That is due to changes the bureau made to the 2025 ACS in an effort to improve the accuracy of these data, including changes to the ACS’ health insurance question and in how it processes survey data.
This blog summarizes the specific changes made to the ACS health insurance questions and related data processing, and then presents SHADAC’s findings on uninsurance and employer-sponsored coverage rates nationally and among the states. We also discuss our rationale for presenting statistical testing between 2024 and 2025 for certain coverage measures, and not others.
Changes to the American Community Survey (ACS) Health Insurance Question and Data Processing
The bureau made changes to both its data collection and data processing for the 2025 ACS with the intent of producing more accurate estimates. Specifically, Census sought to reduce:
- under-reporting Medicaid, which is a long-standing issue in survey data related to the complexity of the program
- over-reporting of direct-purchase coverage (e.g., plans purchased on HealthCare.gov)
- reporting of non-comprehensive coverage (e.g., vision, dental) as comprehensive health coverage
- erroneous reports of multiple coverage
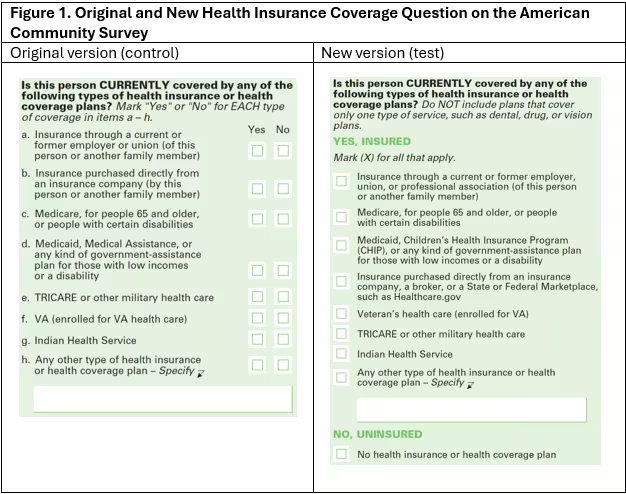
Figure 1 below illustrates the changes Census made to the ACS health insurance question, which include:
- A new question introduction, clarifying that people should not report “plans that cover only one type of service, such as dental, drug, or vision plans.”
- Revised wording for direct-purchase response option, including clarifying examples of coverage purchased directly from “a broker, or a State or Federal Marketplace, such as HealthCare.gov.”
- Revised wording for Medicaid response option, including adding a specific mention of “Children’s Health Insurance Program (CHIP).”
- A response option for people without health insurance: “No health insurance or health coverage plan,” an option that wasn’t offered before.
- Added language to employer-sponsored insurance response option to include coverage from a “professional association” in addition to that from an employer or union.
Figure 1. 2025 American Community Survey (ACS) Health Insurance Question Compared to Original Version
Source: Glassman, B., “Changes to the Health Insurance Question in the 2025 American Community Survey.” U.S. Census Bureau.
In addition to changing the health insurance question, the Census Bureau also revised its data processing procedures.
Previously, all write-in responses from the open-ended “other” coverage option were recoded to existing coverage types (such as Medicaid, direct purchase, etc.). In 2025, the bureau shifted to recoding only write-in responses when a respondent reports no other form of coverage with the stated goal to “prevent inflation of direct purchase or multiple coverage types (and for) more efficient use of resources.” The bureau has also said that “the entire processing routine was updated […] to be cleaner, more logical and help prevent over-imputation of multiple-coverage types.”
As a result of the changes made to the 2025 health insurance coverage question and processing of the data, the Census Bureau “recommends data users compare health insurance estimates to previous years with caution” in its annual brief on health insurance coverage by state, and has opted not to publish comparisons of health coverage estimates to previous years.
After reviewing public documentation of the 2025 ACS health insurance question and processing changes and comparing 2025 health insurance estimates against 2024 estimates, SHADAC has decided to present statistical testing of changes in the rates of uninsured and employer-sponsored coverage comparing 2024 and 2025, though we encourage users to interpret these results with caution as the Census Bureau advises.
We do not present testing of other coverage types (including direct-purchase and Medicaid) because, in those cases, it would be difficult to differentiate real population shifts from the impacts of the changes to the questionnaire and data processing, which were focused on changing the way people interpret and report these types of coverage. We discuss our findings and our assessment of the impacts of the changes to the questionnaire and processing in more detail below.
Uninsurance and ESI Coverage Among the Nonelderly (age 0–64)
In this section, we present our findings of uninsurance estimates among the nonelderly (age 0–64) and children (age 0–18) in 2025 compared to 2024, as well as employer-sponsored insurance (ESI) coverage estimates for the nonelderly.
Uninsurance
We found a statistically significant 0.4 percentage point increase in U.S.-level uninsurance among nonelderly people, increasing from 9.8% in 2024 to 10.2% in 2025.
Though half of states did not experience a statistically significant change in their uninsurance rates among the nonelderly, 23 states recorded statistically significant increases in uninsurance and two (Connecticut and New York) recorded statistically significant declines in uninsurance (Figure 2).
Figure 2. Changes in Nonelderly (0–64) Uninsurance Rates by State Between 2024 and 2025
We also examined uninsurance for children (ages 0-18), finding that the U.S. rate of 6.1% in 2025 for this group was not significantly different from the 2024 estimate. Among the states, 13 experienced statistically significant changes in children’s uninsurance rates between 2024 and 2025—nine with significant increases and four with significant declines (Figure 3).
Figure 3. Changes in Children’s (0–18) Uninsurance Rates by State Between 2024 and 2025
Employer-Sponsored Insurance (ESI) Coverage
Our analysis found a statistically significant 0.3 percentage point increase in ESI among nonelderly people, from 60.1% in 2024 to 60.4% in 2025. While a majority of states did not experience a statistically significant change in their ESI rates among the nonelderly, 10 saw statistically significant increases, and two states (Alaska and Kansas) saw statistically significant decreases.
Why We Present Testing for Changes in Uninsurance and ESI Between 2024 and 2025
We have decided to present the results of testing for changes in uninsurance and ESI between 2024 and 2025 with caution for a few reasons.
For uninsurance, the majority of the changes made to the questionnaire and data processing were designed to impact people’s reporting of what type of coverage they report, rather than whether they have coverage. The limited impact of these changes on uninsurance rates was indicated by a 2022 content test conducted by the Census, which found no statistically significant difference in people having any health insurance using the new approach.
In addition, there was considerable state-level variation in uninsurance rates in 2025. If the changes to the question had a meaningful effect on estimates, one would expect a relatively consistent pattern across the states, such as an increase or a decrease in most or nearly all states. Instead, we found that state-level changes in uninsurance were varied, with a rough split between states experiencing a statistically significant increase in uninsurance versus no change (and two states experiencing a significant decline in uninsurance).
For ESI, the changes to the questionnaire were fairly minimal, only adding “professional association” to the other examples of employer or union. Additionally, the Census Bureau’s 2022 content test found no statistically significant difference in people with ESI coverage with the new question approach.
Similar to uninsurance, if changes to the question had a meaningful effect on estimates, one would expect a relatively consistent pattern across the states, such as an increase or a decrease in most or nearly all states. But instead, we found that state-level changes in ESI were limited and varied.
Why We Focus on the Nonelderly
The 2025 ACS health insurance question and processing changes may disproportionately affect estimates for the elderly population (ages 65 and older) because elderly people with Medicare also often carry supplemental private coverage plans. The 2025 ACS can be expected to reduce capturing these types of private plans in coverage estimates as part of the effort to reduce erroneous overestimates of multiple sources of coverage.
For that reason, SHADAC decided to focus our analysis and reporting of 2025 coverage estimates on the nonelderly population, including children and working-age adults (i.e., ages 64 and younger).
Why We Do Not Present Testing for Changes in Other Types of Coverage
We do not present results for statistical testing of comparisons between 2024 and 2025 for direct-purchase coverage, Medicaid coverage, private coverage, or public coverage.
Direct-Purchase Coverage and Medicaid Coverage
For direct-purchase coverage, our decision not to present testing for changes was because the changes to the questionnaire were specifically aimed at shifting how people interpret and report on this type of coverage.
In addition, our analysis found that direct-purchase coverage declined significantly in all 50 states and the District of Columbia across age groups. This pattern seems difficult to explain except for the impact of the 2025 ACS health insurance question and processing changes, particularly considering that the most notable recent policy changes affecting direct-purchase coverage did not occur until 2026.
For Medicaid coverage, there is a sizeable apparent difference between the 2024 and 2025 U.S.-level estimates for the nonelderly population (which we focus on, as most elderly people are covered primarily by Medicare), with rates that appeared lower in 2025. While that is not consistent with the Census Bureau’s aim of reducing underestimates of Medicaid coverage (i.e., the Medicaid undercount), it is consistent with the bureau’s 2022 content test, which found significantly lower Medicaid coverage using the new approach.
We also found that for the nonelderly population, there was a clear pattern of Medicaid coverage rates that appeared lower in 2025 compared to 2024 for nearly all states (45). While it is possible that Medicaid coverage rates could have dropped between 2024 and 2025, given that states were continuing to disenroll people from Medicaid as part of the COVID-19 pandemic-era Public Health Emergency unwinding process, it seems likely that the 2025 ACS health insurance question and data processing approach changes may have contributed to the apparent differences in Medicaid coverage rates between 2024 and 2025.
Private Coverage and Public Coverage
We have decided not to present testing for changes in the broader public and private coverage categories for two reasons.
First, the Census Bureau’s 2022 content test found significantly lower rates of public and private coverage using the approach adopted in the 2025 ACS, consistent with the patterns we observed in the data. Second, changes in direct-purchase and Medicaid coverage affect aggregated reports of private and public coverage, respectively, because these are component categories of the broader measures. So, the apparent impacts described to estimates of these coverage types may also affect their corresponding aggregate coverage categories.
Looking Forward to 2026 ACS Estimates
There is never a perfect time to make updates to a major data source such as the Census Bureau’s American Community Survey. However, the implementation of these changes to the ACS in 2025 will allow for comparable baseline data to measure key health policy shifts that occurred in 2026 and are forthcoming in 2027.
For example, for direct coverage, 2025 baseline data using the revised ACS health insurance measures will be useful when 2026 data are available to assess the effects of policy changes at the beginning of 2026, including the expiration of enhanced premium tax credits. We will also have two years of comparable baseline data to measure the effects of the Medicaid and Marketplace policy changes of H.R. 1, most of which are scheduled to take effect in 2027.
It will also be important to revisit the 2025 ACS health insurance estimates next year to re-establish trend estimates for all coverage sources, including direct-purchase and Medicaid coverage nationally and across the states. Because we cannot reliably compare these coverage types in 2025 to previous years, it is difficult to examine in depth why the uninsurance rate appears to have increased in 2025. As a result, reviewing 2025 data alongside comparable 2026 data will be crucial for telling a more comprehensive story about coverage nationally and across states.
Related Products
Continue your research and understanding of the latest health insurance coverage estimates by signing up for our monthly newsletter or by reading following SHADAC products:
BLOG and INFOGRAPHIC—CPS ASEC: 2025 National Health Insurance Coverage Rates Held Largely Steady
BRIEF—Comparing Federal Government Surveys That Count the Uninsured: 2025